SC Cleared Contracts in Glasgow

Security Check (SC) Clearance
Scotland > Glasgow

The following table provides summary statistics for contract job vacancies advertised in Glasgow with a requirement for SC Cleared qualifications. Included is a benchmarking guide to the contractor rates offered over the 6 months to 28 April 2024 with a comparison to the same period in the previous 2 years.

6 months to
28 Apr 2024
Same period 2023 Same period 2022
Rank 16 23 27
Rank change year-on-year +7 +4 -6
Contract jobs citing SC Cleared 95 75 65
As % of all contract jobs advertised in Glasgow 10.83% 8.21% 6.47%
As % of the Qualifications category 41.30% 39.47% 34.21%
Number of daily rates quoted 63 57 50
10th Percentile £404 £250 £198
25th Percentile £481 £400 £320
Median daily rate (50th Percentile) £575 £473 £488
Median % change year-on-year +21.69% -3.08% +8.33%
75th Percentile £650 £650 £597
90th Percentile £700 £677 £639
Scotland median daily rate £575 £450 £475
% change year-on-year +27.78% -5.26% +7.95%
Number of hourly rates quoted 4 0 5
10th Percentile - - £18.90
25th Percentile - - £21.00
Median hourly rate £75.00 - £22.00
75th Percentile - - £27.50
90th Percentile - - £36.49
Scotland median hourly rate £60.00 £52.25 £33.42
% change year-on-year +14.83% +56.34% -44.30%

All Academic and Professional Certifications
Glasgow

SC Cleared is in the Academic Qualifications and Professional Certifications category. The following table is for comparison with the above and provides summary statistics for all contract job vacancies advertised in Glasgow with a requirement for academic qualifications or professional certifications.

Contract vacancies requiring academic qualifications or professional certifications 230 190 190
As % of all contract IT jobs advertised in Glasgow 26.23% 20.79% 18.91%
Number of daily rates quoted 134 149 129
10th Percentile £205 £250 £200
25th Percentile £400 £375 £325
Median daily rate (50th Percentile) £513 £450 £450
Median % change year-on-year +13.89% - +5.88%
75th Percentile £600 £588 £550
90th Percentile £668 £650 £625
Scotland median daily rate £500 £450 £450
% change year-on-year +11.11% - +5.88%
Number of hourly rates quoted 13 0 5
10th Percentile - - £18.90
25th Percentile - - £21.00
Median hourly rate £40.94 - £22.00
Median % change year-on-year - - -1.12%
75th Percentile £75.00 - £27.50
90th Percentile - - £36.49
Scotland median hourly rate £40.94 £21.47 £39.99
% change year-on-year +90.73% -46.32% +40.32%

SC Cleared
Job Vacancy Trend in Glasgow

Job postings citing SC Cleared as a proportion of all IT jobs advertised in Glasgow.
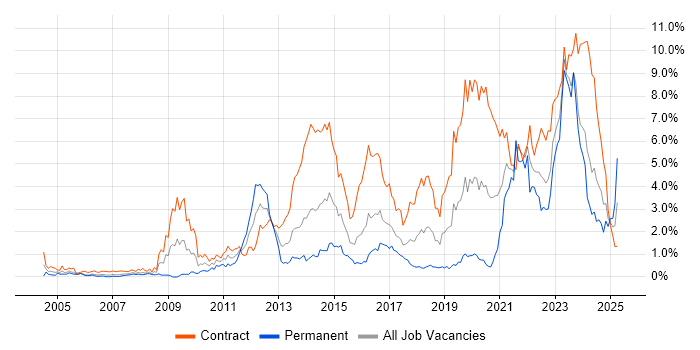
Job vacancy trend for SC Cleared in Glasgow

SC Cleared
Contractor Daily Rate Trend in Glasgow

3-month moving average daily rate quoted in jobs citing SC Cleared in Glasgow.

Daily rate trend for SC Cleared in Glasgow

SC Cleared
Daily Rate Histogram in Glasgow

Daily rate distribution for jobs citing SC Cleared in Glasgow over the 6 months to 28 April 2024.

Daily rate histogram for SC Cleared in Glasgow

SC Cleared
Contractor Hourly Rate Trend in Glasgow

3-month moving average hourly rates quoted in jobs citing SC Cleared in Glasgow.

Hourly rate trend for SC Cleared in Glasgow

SC Cleared
Co-occurring Skills and Capabilities in Glasgow by Category

The follow tables expand on the table above by listing co-occurrences grouped by category. The same employment type, locality and period is covered with up to 20 co-occurrences shown in each of the following categories:

Application Platforms
1 29 (30.53%) Confluence
2 4 (4.21%) Microsoft Exchange
3 2 (2.11%) SharePoint
4 1 (1.05%) IIS
4 1 (1.05%) SharePoint Server
Applications
1 6 (6.32%) Microsoft Excel
2 3 (3.16%) Microsoft Office
3 2 (2.11%) Microsoft Project
4 1 (1.05%) Microsoft PowerPoint
4 1 (1.05%) MS Visio
4 1 (1.05%) Spreadsheet
Cloud Services
1 7 (7.37%) Power Automate
1 7 (7.37%) Power Platform
1 7 (7.37%) PowerApps
2 3 (3.16%) AWS
3 1 (1.05%) Azure
3 1 (1.05%) Entra ID
3 1 (1.05%) Rubrik
Communications & Networking
1 4 (4.21%) VoIP
2 3 (3.16%) DNS
3 1 (1.05%) DHCP
3 1 (1.05%) Firewall
3 1 (1.05%) TCP/IP
3 1 (1.05%) VLAN
3 1 (1.05%) VSAN
Database & Business Intelligence
1 10 (10.53%) SQL Server
2 7 (7.37%) MongoDB
2 7 (7.37%) PostgreSQL
2 7 (7.37%) Power BI
3 1 (1.05%) BusinessObjects
3 1 (1.05%) MariaDB
3 1 (1.05%) MySQL
3 1 (1.05%) NoSQL
3 1 (1.05%) RDBMS
3 1 (1.05%) Relational Database
Development Applications
1 37 (38.95%) JIRA
2 2 (2.11%) Git
3 1 (1.05%) Burp Suite
3 1 (1.05%) Cucumber
3 1 (1.05%) Gatling
3 1 (1.05%) JMeter
3 1 (1.05%) Selenium
3 1 (1.05%) Visual Studio Code
3 1 (1.05%) WebDriver
General
1 37 (38.95%) Public Sector
2 12 (12.63%) Social Skills
3 9 (9.47%) Analytical Skills
4 7 (7.37%) Finance
5 4 (4.21%) Aerospace
5 4 (4.21%) Electronics
5 4 (4.21%) Manufacturing
5 4 (4.21%) Marketing
5 4 (4.21%) Telecoms
6 2 (2.11%) Legal
7 1 (1.05%) Banking
7 1 (1.05%) Documentation Skills
7 1 (1.05%) Law
7 1 (1.05%) Organisational Skills
7 1 (1.05%) Presentation Skills
Job Titles
1 15 (15.79%) Analyst
2 14 (14.74%) Senior
3 12 (12.63%) Consultant
4 9 (9.47%) DBA
4 9 (9.47%) Product Manager
4 9 (9.47%) SQL DBA
5 8 (8.42%) Senior DBA
5 8 (8.42%) Senior SQL DBA
6 7 (7.37%) Data Analyst
6 7 (7.37%) Infrastructure Consultant
6 7 (7.37%) Senior SQL Server DBA
6 7 (7.37%) SQL Server DBA
7 6 (6.32%) Architect
8 5 (5.26%) Senior Analyst
8 5 (5.26%) Senior Data Analyst
9 4 (4.21%) Exchange Engineer
9 4 (4.21%) Security Analyst
9 4 (4.21%) Solutions Architect
9 4 (4.21%) Support Engineer
9 4 (4.21%) Systems Engineer
Libraries, Frameworks & Software Standards
1 3 (3.16%) WebRTC
2 2 (2.11%) RESTful
3 1 (1.05%) .NET
3 1 (1.05%) .NET Remoting
3 1 (1.05%) CSS
3 1 (1.05%) Gherkin
3 1 (1.05%) HTML
3 1 (1.05%) JSON
3 1 (1.05%) React
3 1 (1.05%) REST
3 1 (1.05%) XML
Miscellaneous
1 6 (6.32%) Product Ownership
2 3 (3.16%) Data Centre
3 2 (2.11%) Cyber Threat
3 2 (2.11%) Data Protection Act
3 2 (2.11%) Public Cloud
3 2 (2.11%) Self-Motivation
4 1 (1.05%) Cyber Defence
4 1 (1.05%) iPad
4 1 (1.05%) iPhone
4 1 (1.05%) Mainframe
4 1 (1.05%) Management Information System
Operating Systems
1 8 (8.42%) Linux
2 7 (7.37%) Windows
3 3 (3.16%) Windows Server
4 2 (2.11%) Apple iOS
4 2 (2.11%) Windows Server 2012
5 1 (1.05%) Android
5 1 (1.05%) Kali Linux
5 1 (1.05%) Red Hat Enterprise Linux
5 1 (1.05%) Windows 10
5 1 (1.05%) Windows Server 2016
5 1 (1.05%) Windows Server 2019
Processes & Methodologies
1 29 (30.53%) Agile
2 11 (11.58%) Business Intelligence
3 10 (10.53%) High Availability
3 10 (10.53%) Problem Management
3 10 (10.53%) User Research
4 9 (9.47%) Disaster Recovery
4 9 (9.47%) Project Management
4 9 (9.47%) Visualisation
5 8 (8.42%) Analytics
5 8 (8.42%) Cybersecurity
5 8 (8.42%) Epics
5 8 (8.42%) User Stories
6 7 (7.37%) DevOps
6 7 (7.37%) Risk Management
6 7 (7.37%) Service Design
7 6 (6.32%) Business Case
7 6 (6.32%) Data Analysis
7 6 (6.32%) Data Visualisation
7 6 (6.32%) Roadmaps
8 5 (5.26%) Security Architecture
Programming Languages
1 21 (22.11%) PowerShell
2 9 (9.47%) T-SQL
3 4 (4.21%) Python
4 3 (3.16%) Bash
5 2 (2.11%) Java
5 2 (2.11%) JavaScript
5 2 (2.11%) SQL
Qualifications
1 95 (100.00%) Security Cleared
2 10 (10.53%) DV Cleared
3 2 (2.11%) BPSS Clearance
3 2 (2.11%) Degree
4 1 (1.05%) CGEIT
4 1 (1.05%) CISA
4 1 (1.05%) CISM
4 1 (1.05%) CISSP
4 1 (1.05%) CRISC
4 1 (1.05%) ISO 27001 Lead Auditor
4 1 (1.05%) OSCP
Quality Assurance & Compliance
1 6 (6.32%) PMO
2 5 (5.26%) ISO/IEC 27001
2 5 (5.26%) NIST
3 4 (4.21%) Cyber Essentials
4 1 (1.05%) Accessibility
4 1 (1.05%) ISO 31000
4 1 (1.05%) NCSC
4 1 (1.05%) PCI DSS
4 1 (1.05%) SLA
System Software
1 13 (13.68%) Active Directory
2 2 (2.11%) VMware Infrastructure
3 1 (1.05%) VMware ESXi
3 1 (1.05%) VMware NSX
3 1 (1.05%) vSphere
Systems Management
1 3 (3.16%) Active Directory Federation Services
2 2 (2.11%) Terraform
3 1 (1.05%) Kubernetes
3 1 (1.05%) Microsoft Intune
3 1 (1.05%) WSUS
Vendors
1 21 (22.11%) Atlassian
2 14 (14.74%) Microsoft
3 10 (10.53%) VMware
4 4 (4.21%) Red Hat
4 4 (4.21%) SAP
5 1 (1.05%) Apple
5 1 (1.05%) HP
5 1 (1.05%) Oracle
5 1 (1.05%) ServiceNow