SC Cleared Jobs in Glasgow

Security Check (SC) Clearance
Scotland > Glasgow

The following table provides summary statistics for permanent job vacancies advertised in Glasgow with a requirement for SC Cleared qualifications. Included is a benchmarking guide to the salaries offered over the 6 months to 25 April 2024 with a comparison to the same period in the previous 2 years.

6 months to
25 Apr 2024
Same period 2023 Same period 2022
Rank 124 55 46
Rank change year-on-year -69 -9 +43
Permanent jobs citing SC Cleared 131 77 94
As % of all permanent jobs advertised in Glasgow 3.32% 4.92% 5.85%
As % of the Qualifications category 21.06% 15.78% 21.03%
Number of salaries quoted 31 23 34
10th Percentile - £42,907 -
25th Percentile £51,250 £50,000 -
Median annual salary (50th Percentile) £60,000 £62,000 £48,000
Median % change year-on-year -3.23% +29.17% +28.00%
75th Percentile £79,375 £71,599 -
90th Percentile £82,500 £73,853 £66,250
Scotland median annual salary £60,000 £55,212 £48,000
% change year-on-year +8.67% +15.03% +14.48%

All Academic and Professional Certifications
Glasgow

SC Cleared is in the Academic Qualifications and Professional Certifications category. The following table is for comparison with the above and provides summary statistics for all permanent job vacancies advertised in Glasgow with a requirement for academic qualifications or professional certifications.

Permanent vacancies requiring academic qualifications or professional certifications 622 488 447
As % of all permanent jobs advertised in Glasgow 15.79% 31.16% 27.82%
Number of salaries quoted 206 99 215
10th Percentile £28,250 £31,000 £26,750
25th Percentile £36,063 £41,250 £33,375
Median annual salary (50th Percentile) £50,000 £57,500 £47,500
Median % change year-on-year -13.04% +21.05% +7.95%
75th Percentile £62,188 £69,818 £55,000
90th Percentile £78,125 £77,500 £66,250
Scotland median annual salary £50,000 £54,882 £45,000
% change year-on-year -8.90% +21.96% -

SC Cleared
Job Vacancy Trend in Glasgow

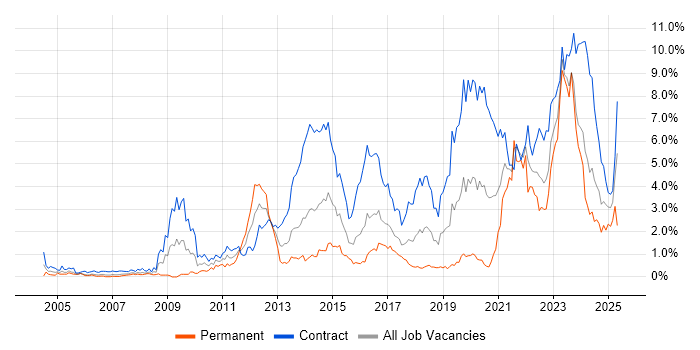
Job postings citing SC Cleared as a proportion of all IT jobs advertised in Glasgow.

Job vacancy trend for SC Cleared in Glasgow

SC Cleared
Salary Trend in Glasgow

3-month moving average salary quoted in jobs citing SC Cleared in Glasgow.

Salary trend for SC Cleared in Glasgow

SC Cleared
Salary Histogram in Glasgow

Salary distribution for jobs citing SC Cleared in Glasgow over the 6 months to 25 April 2024.

Salary histogram for SC Cleared in Glasgow

SC Cleared
Co-occurring Skills and Capabilities in Glasgow by Category

The follow tables expand on the table above by listing co-occurrences grouped by category. The same employment type, locality and period is covered with up to 20 co-occurrences shown in each of the following categories:

Application Platforms
1 30 (22.90%) ArcGIS
1 30 (22.90%) GeoServer
2 8 (6.11%) IIS
3 4 (3.05%) Confluence
3 4 (3.05%) WebLogic
4 2 (1.53%) JBoss
4 2 (1.53%) Red Hat Fuse
Applications
1 4 (3.05%) Sketch
2 2 (1.53%) MS Visio
Business Applications
1 4 (3.05%) Sparx Enterprise Architect
2 3 (2.29%) Remedy ITSM
Cloud Services
1 50 (38.17%) Azure
2 36 (27.48%) AWS
3 6 (4.58%) Miro
4 5 (3.82%) Dynamics 365
5 4 (3.05%) Amazon EKS
5 4 (3.05%) Amazon SQS
5 4 (3.05%) Figma
5 4 (3.05%) Heroku
6 2 (1.53%) Entra ID
6 2 (1.53%) Microsoft 365
6 2 (1.53%) OCI
6 2 (1.53%) Power Platform
Communications & Networking
1 8 (6.11%) WAN
2 7 (5.34%) BGP
3 6 (4.58%) Firewall
4 4 (3.05%) DNS
4 4 (3.05%) SSL
4 4 (3.05%) TCP/IP
5 3 (2.29%) Cisco ASA
5 3 (2.29%) Cisco Firepower
5 3 (2.29%) HSRP
5 3 (2.29%) Intrusion Detection
5 3 (2.29%) MPLS
5 3 (2.29%) OSPF
5 3 (2.29%) Software-Defined Radio
5 3 (2.29%) VLAN
5 3 (2.29%) VRRP
6 1 (0.76%) Network Security
Database & Business Intelligence
1 30 (22.90%) GIS
1 30 (22.90%) PostgreSQL
1 30 (22.90%) QGIS
2 8 (6.11%) SQL Server
3 5 (3.82%) RDBMS
3 5 (3.82%) Relational Database
4 4 (3.05%) Amazon RDS
4 4 (3.05%) Oracle Database
5 1 (0.76%) MySQL
Development Applications
1 9 (6.87%) JIRA
2 2 (1.53%) Git
2 2 (1.53%) IntelliJ
3 1 (0.76%) Jenkins
3 1 (0.76%) Selenium
General
1 34 (25.95%) Social Skills
2 11 (8.40%) Finance
3 9 (6.87%) Public Sector
4 5 (3.82%) Police
5 4 (3.05%) Analytical Skills
5 4 (3.05%) Inclusion and Diversity
6 2 (1.53%) Documentation Skills
7 1 (0.76%) Aerospace
7 1 (0.76%) Games
7 1 (0.76%) Presentation Skills
Job Titles
1 58 (44.27%) Senior
2 32 (24.43%) Software Engineer
3 24 (18.32%) Architect
4 22 (16.79%) Senior Software Engineer
5 14 (10.69%) Systems Engineer
6 13 (9.92%) Solutions Architect
7 12 (9.16%) Lead
8 11 (8.40%) Developer
9 9 (6.87%) Presales Solution Architect
10 8 (6.11%) Senior Systems Engineer
11 7 (5.34%) Analyst
11 7 (5.34%) Designer
12 6 (4.58%) Business Analyst
12 6 (4.58%) Senior Developer
13 5 (3.82%) ERP Developer
13 5 (3.82%) Product Manager
13 5 (3.82%) UI Designer
13 5 (3.82%) UI/UX Designer
13 5 (3.82%) UX Designer
14 4 (3.05%) Senior UX Designer
Libraries, Frameworks & Software Standards
1 30 (22.90%) Leaflet
1 30 (22.90%) OpenLayers
1 30 (22.90%) PostGIS
1 30 (22.90%) React
2 26 (19.85%) .NET
2 26 (19.85%) .NET Core
2 26 (19.85%) CSS
3 10 (7.63%) REST
4 8 (6.11%) WebRTC
5 6 (4.58%) AngularJS
6 5 (3.82%) HTML
7 4 (3.05%) Django
7 4 (3.05%) Express.js
7 4 (3.05%) Node.js
7 4 (3.05%) RabbitMQ
7 4 (3.05%) Spring Boot
8 3 (2.29%) RESTful
8 3 (2.29%) Spring
9 2 (1.53%) Java EE
9 2 (1.53%) JSON
Miscellaneous
1 8 (6.11%) Clustering
2 5 (3.82%) Operational Technology
2 5 (3.82%) Virtual Team
3 4 (3.05%) Enterprise Software
3 4 (3.05%) Public Cloud
4 3 (2.29%) Cyber Threat
4 3 (2.29%) Data Centre
4 3 (2.29%) Product Ownership
5 2 (1.53%) Management Information System
5 2 (1.53%) Self-Motivation
6 1 (0.76%) Onboarding
6 1 (0.76%) SCADA
Operating Systems
1 9 (6.87%) Linux
2 4 (3.05%) Red Hat Enterprise Linux
2 4 (3.05%) Ubuntu
2 4 (3.05%) Windows
3 2 (1.53%) Unix
3 2 (1.53%) Windows Server
4 1 (0.76%) VMS
Processes & Methodologies
1 92 (70.23%) Actionable Insight
2 63 (48.09%) Agile
3 41 (31.30%) DevOps
4 37 (28.24%) Software Engineering
5 35 (26.72%) Problem-Solving
6 30 (22.90%) Web Development
7 16 (12.21%) Prototyping
8 14 (10.69%) Presales
8 14 (10.69%) Stakeholder Management
8 14 (10.69%) Workshop Facilitation
9 13 (9.92%) Business Case
10 12 (9.16%) Cybersecurity
10 12 (9.16%) Load Balancing
10 12 (9.16%) Project Management
10 12 (9.16%) User Research
10 12 (9.16%) User-Centered Design (UCD)
11 11 (8.40%) Customer Experience
11 11 (8.40%) Validation
12 10 (7.63%) User Experience
13 9 (6.87%) IT Strategy
Programming Languages
1 30 (22.90%) JavaScript
1 30 (22.90%) Python
2 17 (12.98%) C#
3 10 (7.63%) SQL
4 3 (2.29%) Java
Qualifications
1 131 (100.00%) Security Cleared
2 11 (8.40%) Degree
3 4 (3.05%) AWS Certification
3 4 (3.05%) AWS Certified Solutions Architect
3 4 (3.05%) Azure Certification
3 4 (3.05%) Cisco Certification
3 4 (3.05%) PRINCE2 Practitioner
4 3 (2.29%) CCIE
4 3 (2.29%) CCNP
5 2 (1.53%) MCSE
5 2 (1.53%) Microsoft Certification
6 1 (0.76%) CCNA
6 1 (0.76%) Computer Science Degree
Quality Assurance & Compliance
1 10 (7.63%) Accessibility
2 5 (3.82%) WCAG
3 3 (2.29%) COBIT
3 3 (2.29%) ISO/IEC 15288
4 1 (0.76%) NCSC
4 1 (0.76%) NIST
4 1 (0.76%) PMO
System Software
1 8 (6.11%) VMware Infrastructure
1 8 (6.11%) VMware NSX
2 3 (2.29%) Active Directory
Systems Management
1 3 (2.29%) OpenView
2 1 (0.76%) SCCM
2 1 (0.76%) WSUS
Vendors
1 30 (22.90%) ESRI
2 15 (11.45%) Microsoft
3 11 (8.40%) VMware
4 8 (6.11%) Oracle
5 4 (3.05%) Cisco
5 4 (3.05%) Sparx
6 3 (2.29%) BMC
6 3 (2.29%) HP
6 3 (2.29%) Remedy
6 3 (2.29%) ServiceNow
7 1 (0.76%) Apple
7 1 (0.76%) Cadence
7 1 (0.76%) Juniper
7 1 (0.76%) Palo Alto