SFIA Contracts with Work from Home Options

Skills Framework for the Information Age (SFIA)
UK > Work from Home

The table below provides summary statistics for contract job vacancies with an option to work from home (WFH) and a requirement for SFIA skills. Included is a benchmarking guide to the contractor rates offered in vacancies that have cited SFIA over the 6 months to 6 May 2024 with a comparison to the same period in the previous 2 years.

6 months to
6 May 2024
Same period 2023 Same period 2022
Rank 326 453 595
Rank change year-on-year +127 +142 -115
Contract jobs citing SFIA 18 21 24
As % of all contract jobs with a WFH option 0.12% 0.082% 0.054%
As % of the Processes & Methodologies category 0.13% 0.092% 0.059%
Number of daily rates quoted 14 19 13
10th Percentile £474 £360 £380
25th Percentile £500 £400 £400
Median daily rate (50th Percentile) £550 £550 £500
Median % change year-on-year - +10.00% -
75th Percentile £615 £598 £656
90th Percentile £634 £641 £730
UK median daily rate £525 £555 £488
% change year-on-year -5.41% +13.85% -7.14%
Number of hourly rates quoted 0 0 2
10th Percentile - - £18.09
25th Percentile - - £18.24
Median hourly rate - - £19.73
75th Percentile - - £20.98
90th Percentile - - £20.99
UK median hourly rate - - £19.73
% change year-on-year - - -40.21%

All Process and Methodology Skills
Work from Home

SFIA is in the Processes and Methodologies category. The following table is for comparison with the above and provides summary statistics for all contract job vacancies with a WFH option and a requirement for process or methodology skills.

Contract vacancies with a requirement for process or methodology skills 13,387 22,922 40,601
As % of all contract jobs with a WFH option 87.93% 89.77% 91.08%
Number of daily rates quoted 8,971 16,192 29,477
10th Percentile £325 £363 £363
25th Percentile £425 £450 £431
Median daily rate (50th Percentile) £525 £540 £525
Median % change year-on-year -2.78% +2.86% +8.25%
75th Percentile £638 £650 £630
90th Percentile £750 £750 £725
UK median daily rate £525 £550 £530
% change year-on-year -4.55% +3.77% +8.72%
Number of hourly rates quoted 576 528 542
10th Percentile £15.08 £18.68 £13.75
25th Percentile £24.25 £30.00 £20.00
Median hourly rate £42.50 £55.00 £35.00
Median % change year-on-year -22.73% +57.14% +40.00%
75th Percentile £60.00 £68.81 £55.63
90th Percentile £75.13 £80.25 £67.50
UK median hourly rate £35.96 £36.00 £25.00
% change year-on-year -0.11% +44.00% +2.04%

SFIA
Trend for Jobs with a WFH Option

Job vacancies with a work from home option citing SFIA as a proportion of all IT jobs advertised.
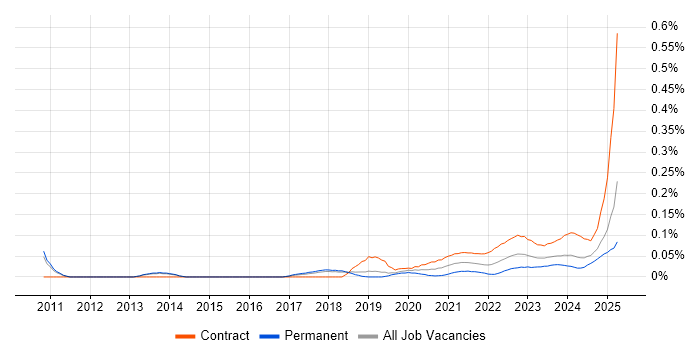
SFIA trend for jobs with a WFH option

SFIA
Daily Rate Trend for Jobs with a WFH Option

3-month moving average daily rate quoted in job vacancies with a work from home option citing SFIA.

SFIA daily rate for jobs with a WFH option

SFIA
Daily Rate Histogram for Jobs with a WFH Option

Daily rate distribution for jobs with a work from home option citing SFIA over the 6 months to 6 May 2024.

SFIA daily rate histogram for jobs with a WFH option

SFIA
Co-occurring Skills and Capabilities with WFH Options by Category

The follow tables expand on the table above by listing co-occurrences grouped by category. The same employment type, locality and period is covered with up to 20 co-occurrences shown in each of the following categories:

Application Platforms
1 1 (5.56%) nginx
1 1 (5.56%) SharePoint
1 1 (5.56%) Tomcat
Applications
1 3 (16.67%) Trello
Business Applications
1 5 (27.78%) Sparx Enterprise Architect
Cloud Services
1 9 (50.00%) Azure
2 6 (33.33%) AWS
3 4 (22.22%) Microsoft 365
4 3 (16.67%) Miro
4 3 (16.67%) PaaS
4 3 (16.67%) SaaS
5 2 (11.11%) Azure Stack
5 2 (11.11%) Microsoft Purview
6 1 (5.56%) Amazon ElastiCache
6 1 (5.56%) Amazon OpenSearch
6 1 (5.56%) Amazon SQS
6 1 (5.56%) Azure Service Bus
6 1 (5.56%) Azure Synapse Analytics
6 1 (5.56%) GCP
6 1 (5.56%) OCI
Communications & Networking
1 1 (5.56%) LAN
1 1 (5.56%) WAN
Database & Business Intelligence
1 2 (11.11%) Data Warehouse
1 2 (11.11%) Snowflake Schema
2 1 (5.56%) Amazon Aurora
2 1 (5.56%) Amazon RDS
2 1 (5.56%) Elasticsearch
2 1 (5.56%) PostgreSQL
Development Applications
1 1 (5.56%) Bitbucket
1 1 (5.56%) Cucumber
1 1 (5.56%) EasyMock
1 1 (5.56%) Jenkins
1 1 (5.56%) JUnit
1 1 (5.56%) Maven
1 1 (5.56%) Mockito
1 1 (5.56%) Postman
1 1 (5.56%) Selenium
1 1 (5.56%) SonarQube
1 1 (5.56%) TestNG
General
1 7 (38.89%) Public Sector
2 5 (27.78%) Local Government
3 3 (16.67%) Social Skills
4 1 (5.56%) Analytical Skills
4 1 (5.56%) Back Office
4 1 (5.56%) Influencing Skills
Job Titles
1 9 (50.00%) Architect
2 6 (33.33%) Solutions Architect
3 3 (16.67%) DevOps Engineer
4 2 (11.11%) Data Architect
4 2 (11.11%) IT Manager
4 2 (11.11%) IT Services Manager
4 2 (11.11%) Service Manager
4 2 (11.11%) Service Transition Manager
4 2 (11.11%) Transition Manager
5 1 (5.56%) Agile Product Owner
5 1 (5.56%) Analyst
5 1 (5.56%) Backend Developer
5 1 (5.56%) Change Analyst
5 1 (5.56%) Developer
5 1 (5.56%) Integration Architect
5 1 (5.56%) Portfolio Manager
5 1 (5.56%) Product Owner
5 1 (5.56%) Senior Product Owner
5 1 (5.56%) Technical Architect
5 1 (5.56%) Technical Solutions Architect
Libraries, Frameworks & Software Standards
1 3 (16.67%) REST
2 2 (11.11%) JSON
2 2 (11.11%) XML
3 1 (5.56%) Elastic Stack
3 1 (5.56%) Gherkin
3 1 (5.56%) Guice
3 1 (5.56%) JAX-RS
3 1 (5.56%) Kafka
3 1 (5.56%) Mustache
3 1 (5.56%) OpenAPI
3 1 (5.56%) Spring
3 1 (5.56%) Spring Boot
3 1 (5.56%) Swagger
3 1 (5.56%) WireMock
Miscellaneous
1 3 (16.67%) Product Ownership
2 2 (11.11%) Data Structures
2 2 (11.11%) Reference Data
3 1 (5.56%) Management Information System
3 1 (5.56%) Onboarding
3 1 (5.56%) Public Cloud
Operating Systems
1 3 (16.67%) Windows
Processes & Methodologies
1 8 (44.44%) Agile
1 8 (44.44%) Data Management
1 8 (44.44%) TOGAF
2 5 (27.78%) ArchiMate
2 5 (27.78%) BPMN
2 5 (27.78%) Change Management
2 5 (27.78%) Cybersecurity
2 5 (27.78%) Enterprise Modelling
2 5 (27.78%) IT4IT
2 5 (27.78%) PRINCE2
2 5 (27.78%) Technical Architecture
3 4 (22.22%) DevOps
3 4 (22.22%) Project Management
3 4 (22.22%) Service Management
3 4 (22.22%) Test Automation
4 3 (16.67%) Analytics
4 3 (16.67%) ITIL
4 3 (16.67%) Microservices
4 3 (16.67%) OOP
4 3 (16.67%) Performance Testing
Programming Languages
1 1 (5.56%) Java
Qualifications
1 7 (38.89%) SC Cleared
1 7 (38.89%) Security Cleared
2 3 (16.67%) Degree
3 2 (11.11%) BPSS Clearance
3 2 (11.11%) ISEB
4 1 (5.56%) DV Cleared
4 1 (5.56%) NVQ Level 3
Quality Assurance & Compliance
1 7 (38.89%) COBIT
2 5 (27.78%) ISO 22301
2 5 (27.78%) ISO/IEC 20000
2 5 (27.78%) ISO/IEC 27001
3 2 (11.11%) Data Quality
4 1 (5.56%) PCI DSS
System Software
1 1 (5.56%) Docker
Systems Management
1 1 (5.56%) Ansible
1 1 (5.56%) Kubernetes
1 1 (5.56%) Kustomize
1 1 (5.56%) Microsoft Intune
1 1 (5.56%) Packer
1 1 (5.56%) Terraform
Vendors
1 5 (27.78%) Sparx
2 4 (22.22%) Microsoft
3 3 (16.67%) Dynatrace
3 3 (16.67%) Splunk
4 1 (5.56%) JD Edwards
4 1 (5.56%) Oracle
4 1 (5.56%) Red Hat
4 1 (5.56%) ServiceNow
4 1 (5.56%) SnapLogic