JIRA Contracts with Work from Home Options

Atlassian JIRA
UK > Work from Home

The table below provides summary statistics for contract job vacancies with an option to work from home (WFH) and a requirement for JIRA skills. Included is a benchmarking guide to the contractor rates offered in vacancies that have cited JIRA over the 6 months to 23 April 2024 with a comparison to the same period in the previous 2 years.

6 months to
23 Apr 2024
Same period 2023 Same period 2022
Rank 40 44 33
Rank change year-on-year +4 -11 +13
Contract jobs citing JIRA 701 1,270 2,703
As % of all contract jobs with a WFH option 4.52% 4.85% 6.04%
As % of the Development Applications category 37.61% 31.50% 32.33%
Number of daily rates quoted 457 880 1,900
10th Percentile £350 £325 £356
25th Percentile £425 £413 £419
Median daily rate (50th Percentile) £500 £520 £500
Median % change year-on-year -3.85% +4.00% +5.26%
75th Percentile £600 £600 £600
90th Percentile £675 £740 £688
UK median daily rate £525 £525 £518
% change year-on-year - +1.45% +8.95%
Number of hourly rates quoted 16 36 68
10th Percentile £10.50 £36.50 -
25th Percentile £36.25 £51.81 £39.75
Median hourly rate £40.00 £67.51 £44.50
Median % change year-on-year -40.75% +51.71% -1.11%
75th Percentile £65.00 £75.00 £56.50
90th Percentile - £84.58 £66.22
UK median hourly rate £45.00 £65.84 £44.50
% change year-on-year -31.66% +47.96% -2.20%

All Development Application Skills
Work from Home

JIRA is in the Development Applications category. The following table is for comparison with the above and provides summary statistics for all contract job vacancies with a WFH option and a requirement for development application skills.

Contract vacancies with a requirement for development application skills 1,864 4,032 8,361
As % of all contract jobs with a WFH option 12.02% 15.40% 18.68%
Number of daily rates quoted 1,334 2,883 6,050
10th Percentile £363 £400 £381
25th Percentile £425 £450 £450
Median daily rate (50th Percentile) £513 £545 £525
Median % change year-on-year -5.96% +3.81% +7.69%
75th Percentile £600 £650 £625
90th Percentile £700 £750 £712
UK median daily rate £525 £550 £550
% change year-on-year -4.55% - +12.24%
Number of hourly rates quoted 42 124 102
10th Percentile £27.62 £45.00 -
25th Percentile £47.06 £54.75 £39.75
Median hourly rate £67.50 £65.00 £50.00
Median % change year-on-year +3.85% +30.00% +11.11%
75th Percentile £90.00 £70.00 £61.61
90th Percentile - £78.37 £67.77
UK median hourly rate £62.50 £61.50 £50.50
% change year-on-year +1.63% +21.78% +12.22%

JIRA
Trend for Jobs with a WFH Option

Job vacancies with a work from home option citing JIRA as a proportion of all IT jobs advertised.
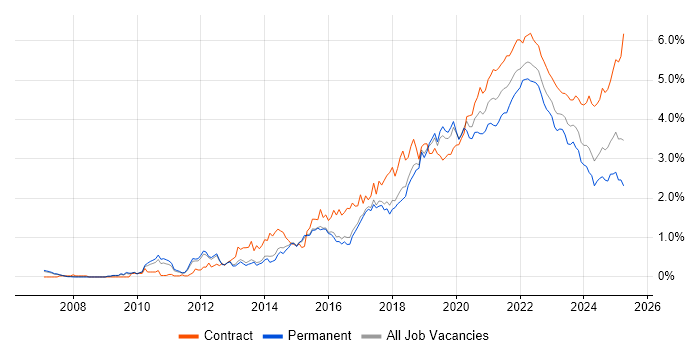
JIRA trend for jobs with a WFH option

JIRA
Daily Rate Trend for Jobs with a WFH Option

3-month moving average daily rate quoted in job vacancies with a work from home option citing JIRA.

JIRA daily rate for jobs with a WFH option

JIRA
Daily Rate Histogram for Jobs with a WFH Option

Daily rate distribution for jobs with a work from home option citing JIRA over the 6 months to 23 April 2024.

JIRA daily rate histogram for jobs with a WFH option

JIRA
Hourly Rate Trend for Jobs with a WFH Option

3-month moving average hourly rate quoted in job vacancies with a work from home option citing JIRA.

JIRA hourly rate for jobs with a WFH option

JIRA
Hourly Rate Histogram for Jobs with a WFH Option

Hourly rate distribution for jobs with a work from home option citing JIRA over the 6 months to 23 April 2024.

JIRA hourly rate histogram for jobs with a WFH option

JIRA
Co-occurring Skills and Capabilities with WFH Options by Category

The follow tables expand on the table above by listing co-occurrences grouped by category. The same employment type, locality and period is covered with up to 20 co-occurrences shown in each of the following categories:

Application Platforms
1 294 (41.94%) Confluence
2 40 (5.71%) SharePoint
3 19 (2.71%) SharePoint Server
4 13 (1.85%) Microsoft Exchange
5 11 (1.57%) Adobe Experience Manager
5 11 (1.57%) CMS
6 6 (0.86%) IIS
7 4 (0.57%) JBoss
7 4 (0.57%) Oracle SOA Suite
8 3 (0.43%) Appian
8 3 (0.43%) nginx
9 2 (0.29%) Apache
9 2 (0.29%) Tomcat
10 1 (0.14%) Apache Spark
10 1 (0.14%) Drupal
10 1 (0.14%) Mule
10 1 (0.14%) SAS
10 1 (0.14%) SharePoint 2013
10 1 (0.14%) Sitecore CMS
10 1 (0.14%) WildFly
Applications
1 37 (5.28%) Microsoft Excel
2 33 (4.71%) Microsoft Office
3 26 (3.71%) Microsoft Project
4 25 (3.57%) MS Visio
5 24 (3.42%) Microsoft PowerPoint
6 5 (0.71%) Trello
7 2 (0.29%) Spreadsheet
8 1 (0.14%) InVision
8 1 (0.14%) Sketch
Business Applications
1 11 (1.57%) SAP Hybris
2 6 (0.86%) SAP S/4HANA
3 4 (0.57%) Remedy ITSM
3 4 (0.57%) Temenos T24
4 3 (0.43%) Loan IQ
4 3 (0.43%) Oracle Procure-to-Pay
5 2 (0.29%) Dynamics CRM
5 2 (0.29%) SAP CO
5 2 (0.29%) SAP FI
5 2 (0.29%) SAP FI/CO
5 2 (0.29%) SAP SD
6 1 (0.14%) Dynamics AX
6 1 (0.14%) Maximo
6 1 (0.14%) Oracle Assets
6 1 (0.14%) Oracle Cash Management
6 1 (0.14%) Oracle EBS
6 1 (0.14%) Oracle ERP
6 1 (0.14%) Oracle Financials
6 1 (0.14%) Oracle Receivables
6 1 (0.14%) Summit
Cloud Services
1 176 (25.11%) Azure
2 133 (18.97%) AWS
3 55 (7.85%) Azure DevOps
3 55 (7.85%) GitHub
4 47 (6.70%) Power Platform
5 34 (4.85%) GCP
6 32 (4.56%) Microsoft 365
7 31 (4.42%) SaaS
8 22 (3.14%) PowerApps
9 18 (2.57%) Azure Stack
10 17 (2.43%) Slack
11 15 (2.14%) Power Automate
11 15 (2.14%) Serverless
12 14 (2.00%) IaaS
12 14 (2.00%) SAP Commerce Cloud
13 12 (1.71%) Miro
14 11 (1.57%) Dynamics 365
14 11 (1.57%) PaaS
15 10 (1.43%) AWS Lambda
16 9 (1.28%) Asana
Communications & Networking
1 46 (6.56%) Firewall
2 23 (3.28%) TCP/IP
3 21 (3.00%) DNS
4 19 (2.71%) BGP
5 16 (2.28%) Intranet
6 12 (1.71%) VPN
7 9 (1.28%) DHCP
8 8 (1.14%) VLAN
9 7 (1.00%) Kerberos
9 7 (1.00%) NAS
9 7 (1.00%) SAN
10 6 (0.86%) HTTP
10 6 (0.86%) Intrusion Detection
11 5 (0.71%) DSL
11 5 (0.71%) FIX Connectivity
12 4 (0.57%) tcpdump
12 4 (0.57%) VSAN
12 4 (0.57%) Wireless
12 4 (0.57%) Wireshark
13 3 (0.43%) OpenLDAP
Database & Business Intelligence
1 44 (6.28%) SQL Server
2 37 (5.28%) Power BI
3 23 (3.28%) PostgreSQL
4 18 (2.57%) Relational Database
5 16 (2.28%) MongoDB
6 15 (2.14%) Data Warehouse
7 12 (1.71%) SQL Server Integration Services
7 12 (1.71%) Tableau
8 10 (1.43%) Oracle Database
9 9 (1.28%) Amazon Redshift
10 8 (1.14%) Elasticsearch
10 8 (1.14%) MySQL
11 7 (1.00%) NoSQL
11 7 (1.00%) Oracle ODI
12 6 (0.86%) Amazon RDS
12 6 (0.86%) PowerCenter
13 5 (0.71%) Apache Hive
13 5 (0.71%) Data Mart
13 5 (0.71%) Hadoop
13 5 (0.71%) SQL Server Reporting Services
Development Applications
1 96 (13.69%) Git
2 81 (11.55%) Jenkins
3 38 (5.42%) GitLab
4 32 (4.56%) Bitbucket
5 22 (3.14%) Selenium
6 21 (3.00%) TeamCity
7 19 (2.71%) Cucumber
8 17 (2.43%) Cypress.io
9 12 (1.71%) JMeter
9 12 (1.71%) SonarQube
10 10 (1.43%) Eclipse
11 9 (1.28%) Postman
11 9 (1.28%) REST Assured
12 8 (1.14%) Bitbucket Server
12 8 (1.14%) Subversion
12 8 (1.14%) Team Foundation Server
12 8 (1.14%) TestRail
13 7 (1.00%) Maven
13 7 (1.00%) SQL Server Management Studio (SSMS)
13 7 (1.00%) webpack
General
1 237 (33.81%) Social Skills
2 151 (21.54%) Finance
3 99 (14.12%) Public Sector
4 97 (13.84%) Analytical Skills
5 43 (6.13%) Banking
6 26 (3.71%) Marketing
7 24 (3.42%) Retail
8 20 (2.85%) Front Office
9 19 (2.71%) Manufacturing
9 19 (2.71%) Presentation Skills
10 18 (2.57%) Telecoms
11 12 (1.71%) Influencing Skills
12 11 (1.57%) Organisational Skills
13 10 (1.43%) Pharmaceutical
14 9 (1.28%) Law
15 8 (1.14%) Police
16 7 (1.00%) Investment Banking
16 7 (1.00%) Publishing
17 6 (0.86%) Aerospace
18 5 (0.71%) Electronics
Job Titles
1 138 (19.69%) Analyst
2 83 (11.84%) Senior
3 77 (10.98%) Developer
4 70 (9.99%) Business Analyst
5 50 (7.13%) Project Manager
6 43 (6.13%) Lead
7 34 (4.85%) Architect
8 25 (3.57%) Data Engineer
9 24 (3.42%) Consultant
9 24 (3.42%) Technical Analyst
10 23 (3.28%) DevOps Engineer
11 22 (3.14%) Administrator
12 19 (2.71%) Software Engineer
13 18 (2.57%) Senior Analyst
13 18 (2.57%) Test Analyst
13 18 (2.57%) Test Engineer
14 17 (2.43%) Microsoft Engineer
15 16 (2.28%) Delivery Manager
16 14 (2.00%) DBA
16 14 (2.00%) Full Stack Developer
Libraries, Frameworks & Software Standards
1 49 (6.99%) REST
2 36 (5.14%) HTML
3 32 (4.56%) CSS
4 29 (4.14%) React
4 29 (4.14%) XML
5 26 (3.71%) JSON
6 21 (3.00%) SOAP
7 18 (2.57%) .NET
7 18 (2.57%) Web Services
8 16 (2.28%) AngularJS
9 15 (2.14%) RESTful
10 14 (2.00%) Node.js
11 13 (1.85%) LDAP
11 13 (1.85%) Middleware
12 11 (1.57%) Spring
12 11 (1.57%) Spring Boot
13 10 (1.43%) Swagger
14 9 (1.28%) Java EE
15 8 (1.14%) Kafka
15 8 (1.14%) RabbitMQ
Miscellaneous
1 21 (3.00%) Private Cloud
1 21 (3.00%) Product Ownership
2 17 (2.43%) Data Centre
2 17 (2.43%) Management Information System
3 16 (2.28%) Public Cloud
4 15 (2.14%) Virtual Team
5 14 (2.00%) Onboarding
6 9 (1.28%) Mobile App
7 8 (1.14%) Hybrid Cloud
8 7 (1.00%) Clustering
8 7 (1.00%) Derivative
8 7 (1.00%) Replication
8 7 (1.00%) Video Conferencing
9 6 (0.86%) Algorithms
9 6 (0.86%) Data Protection Act
9 6 (0.86%) Foreign Exchange (FX)
9 6 (0.86%) Life Science
10 5 (0.71%) Data Structures
10 5 (0.71%) Fixed Income
11 4 (0.57%) Device Driver
Operating Systems
1 74 (10.56%) Windows
2 62 (8.84%) Linux
3 28 (3.99%) Unix
4 18 (2.57%) Red Hat Enterprise Linux
5 16 (2.28%) Windows Server
6 7 (1.00%) Oracle Linux
6 7 (1.00%) Solaris
7 6 (0.86%) AIX
7 6 (0.86%) Android
8 5 (0.71%) Apple iOS
8 5 (0.71%) Windows 10
9 4 (0.57%) Embedded Linux
10 3 (0.43%) Windows Server 2012
10 3 (0.43%) Windows Server 2016
11 2 (0.29%) Mac OS
11 2 (0.29%) Ubuntu
11 2 (0.29%) VMS
11 2 (0.29%) Windows 2000
11 2 (0.29%) Windows Server 2019
11 2 (0.29%) Windows XP
Processes & Methodologies
1 356 (50.78%) Agile
2 177 (25.25%) DevOps
3 100 (14.27%) Stakeholder Management
4 98 (13.98%) Problem-Solving
5 97 (13.84%) Scrum
6 94 (13.41%) Project Management
7 75 (10.70%) Test Automation
8 72 (10.27%) CI/CD
9 71 (10.13%) Migration
10 66 (9.42%) User Stories
11 63 (8.99%) Business Intelligence
12 56 (7.99%) Continuous Improvement
13 53 (7.56%) Project Delivery
14 52 (7.42%) Software Engineering
15 50 (7.13%) Roadmaps
16 49 (6.99%) Kanban
17 47 (6.70%) Analytics
17 47 (6.70%) Waterfall
18 46 (6.56%) Service Management
19 45 (6.42%) Continuous Integration
Programming Languages
1 102 (14.55%) Python
2 98 (13.98%) SQL
3 73 (10.41%) JavaScript
4 62 (8.84%) Java
5 50 (7.13%) PowerShell
6 35 (4.99%) C#
7 29 (4.14%) Bash
8 25 (3.57%) Shell Script
9 24 (3.42%) TypeScript
10 17 (2.43%) C++
11 11 (1.57%) Ruby
11 11 (1.57%) T-SQL
12 10 (1.43%) C
13 9 (1.28%) Go
13 9 (1.28%) PL/SQL
14 7 (1.00%) Perl
14 7 (1.00%) Scala
15 6 (0.86%) Groovy
16 5 (0.71%) F#
16 5 (0.71%) PHP
Qualifications
1 168 (23.97%) Security Cleared
2 137 (19.54%) SC Cleared
3 94 (13.41%) Degree
4 26 (3.71%) DV Cleared
5 14 (2.00%) ISTQB
6 13 (1.85%) Master's Degree
7 9 (1.28%) PMP
8 8 (1.14%) Computer Science Degree
9 7 (1.00%) BPSS Clearance
10 6 (0.86%) PMI Certification
11 5 (0.71%) ISEB
11 5 (0.71%) ISTQB Foundation Certification
12 4 (0.57%) CSPO
12 4 (0.57%) ITIL Certification
12 4 (0.57%) Microsoft Certification
12 4 (0.57%) PhD
13 3 (0.43%) AWS Certification
14 2 (0.29%) ISTQB Advanced Certification
14 2 (0.29%) MBA
14 2 (0.29%) PRINCE2 Certification
Quality Assurance & Compliance
1 65 (9.27%) QA
2 37 (5.28%) PMO
3 21 (3.00%) Government Security Classifications
4 12 (1.71%) Data Quality
4 12 (1.71%) GDPR
5 11 (1.57%) Accessibility
6 10 (1.43%) NIST
7 8 (1.14%) Disclosure Scotland
7 8 (1.14%) NCSC
8 7 (1.00%) Sarbanes-Oxley
9 6 (0.86%) GxP
10 4 (0.57%) JTAG
10 4 (0.57%) SLA
11 3 (0.43%) ISO 9001
11 3 (0.43%) ISO/IEC 27001
11 3 (0.43%) PCI DSS
12 2 (0.29%) Cyber Essentials
12 2 (0.29%) ISO 20022
12 2 (0.29%) ISO/IEC 12207
12 2 (0.29%) WCAG
System Software
1 39 (5.56%) Docker
2 33 (4.71%) Active Directory
3 14 (2.00%) VMware Infrastructure
4 12 (1.71%) vSphere
5 8 (1.14%) VMware NSX
6 7 (1.00%) Virtual Machines
7 6 (0.86%) Firmware
7 6 (0.86%) Oracle RAC
7 6 (0.86%) VMware ESXi
8 4 (0.57%) Embedded Firmware
8 4 (0.57%) Snort
9 3 (0.43%) vCloud
9 3 (0.43%) Virtual Desktop
9 3 (0.43%) VirtualBox
10 1 (0.14%) HDFS
10 1 (0.14%) iptables
Systems Management
1 58 (8.27%) Terraform
2 55 (7.85%) Ansible
3 52 (7.42%) Kubernetes
4 17 (2.43%) SCOM
5 16 (2.28%) Progress Chef
6 15 (2.14%) Kibana
6 15 (2.14%) Puppet
7 12 (1.71%) Grafana
8 11 (1.57%) Docker Swarm
9 8 (1.14%) Podman
10 7 (1.00%) EMC NetWorker
10 7 (1.00%) Netcool
10 7 (1.00%) Red Hat Satellite
10 7 (1.00%) Tivoli
10 7 (1.00%) Tivoli Storage Manager
11 6 (0.86%) Data Guard
11 6 (0.86%) logstash
11 6 (0.86%) Oracle Enterprise Manager
11 6 (0.86%) Prometheus
11 6 (0.86%) vCenter Server
Vendors
1 108 (15.41%) Microsoft
2 98 (13.98%) Atlassian
3 67 (9.56%) Oracle
4 43 (6.13%) SAP
5 41 (5.85%) ServiceNow
6 27 (3.85%) Splunk
7 21 (3.00%) VMware
8 19 (2.71%) Google
8 19 (2.71%) Salesforce
9 15 (2.14%) Dell
10 14 (2.00%) Adobe
10 14 (2.00%) HP
11 13 (1.85%) IBM
12 12 (1.71%) Databricks
12 12 (1.71%) Palo Alto
12 12 (1.71%) Red Hat
13 11 (1.57%) Cisco
14 9 (1.28%) Bloomberg
15 8 (1.14%) CyberArk
15 8 (1.14%) Informatica