DV Cleared Contracts with Work from Home Options

Developed Vetting (DV) Clearance
UK > Work from Home

The following table provides summary statistics for contract job vacancies with an option to work from home (WFH) with a requirement for DV Cleared qualifications. Included is a benchmarking guide to the contractor rates offered over the 6 months to 23 April 2024 with a comparison to the same period in the previous 2 years.

6 months to
23 Apr 2024
Same period 2023 Same period 2022
Rank 62 123 305
Rank change year-on-year +61 +182 -70
Contract jobs citing DV Cleared 484 510 362
As % of all contract jobs with a WFH option 3.12% 1.95% 0.81%
As % of the Qualifications category 11.16% 7.61% 4.04%
Number of daily rates quoted 327 348 245
10th Percentile £410 £450 £375
25th Percentile £493 £525 £469
Median daily rate (50th Percentile) £600 £600 £550
Median % change year-on-year - +9.09% +11.11%
75th Percentile £688 £694 £663
90th Percentile £788 £740 £748
UK median daily rate £600 £600 £563
% change year-on-year - +6.67% +12.50%
Number of hourly rates quoted 15 29 6
10th Percentile £56.52 £47.50 £64.38
25th Percentile £68.00 £62.50 £69.06
Median hourly rate £87.46 £67.50 £73.25
Median % change year-on-year +29.57% -7.85% +24.68%
75th Percentile £87.53 £78.75 £76.44
90th Percentile - £87.55 £80.75
UK median hourly rate £67.50 £70.00 £69.05
% change year-on-year -3.57% +1.38% +38.10%

All Academic and Professional Certifications
Work from Home

DV Cleared is in the Academic Qualifications and Professional Certifications category. The following table is for comparison with the above and provides summary statistics for all contract job vacancies with a WFH option and a requirement for academic qualifications or professional certifications.

Contract vacancies requiring academic qualifications or professional certifications 4,337 6,705 8,954
As % of all contract jobs with a WFH option 27.97% 25.62% 20.01%
Number of daily rates quoted 2,705 4,503 6,256
10th Percentile £332 £380 £363
25th Percentile £438 £455 £450
Median daily rate (50th Percentile) £525 £550 £530
Median % change year-on-year -4.55% +3.77% +7.07%
75th Percentile £638 £650 £625
90th Percentile £725 £745 £700
UK median daily rate £534 £550 £525
% change year-on-year -3.00% +4.76% +8.81%
Number of hourly rates quoted 254 312 226
10th Percentile £14.45 £20.00 £19.35
25th Percentile £24.00 £42.50 £33.13
Median hourly rate £43.00 £65.00 £48.00
Median % change year-on-year -33.85% +35.42% +20.00%
75th Percentile £65.00 £73.75 £65.25
90th Percentile £83.50 £85.00 £69.38
UK median hourly rate £40.00 £54.28 £40.93
% change year-on-year -26.31% +32.62% +6.31%

DV Cleared
Trend for Jobs with a WFH Option

Job vacancies with a work from home option citing DV Cleared as a proportion of all IT jobs advertised.
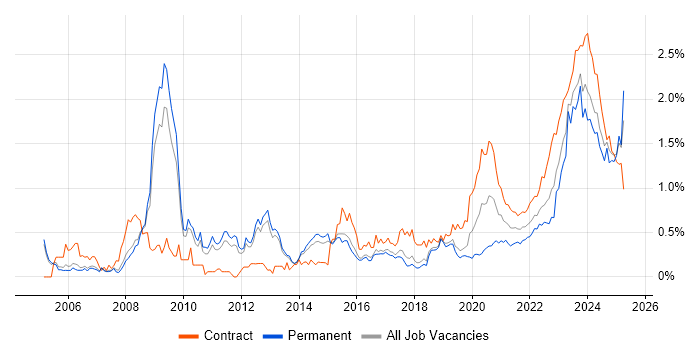
DV Cleared trend for jobs with a WFH option

DV Cleared
Daily Rate Trend for Jobs with a WFH Option

3-month moving average daily rate quoted in job vacancies with a work from home option citing DV Cleared.

DV Cleared daily rate for jobs with a WFH option

DV Cleared
Daily Rate Histogram for Jobs with a WFH Option

Daily rate distribution for jobs with a work from home option citing DV Cleared over the 6 months to 23 April 2024.

DV Cleared daily rate histogram for jobs with a WFH option

DV Cleared
Hourly Rate Trend for Jobs with a WFH Option

3-month moving average hourly rate quoted in job vacancies with a work from home option citing DV Cleared.

DV Cleared hourly rate for jobs with a WFH option

DV Cleared
Hourly Rate Histogram for Jobs with a WFH Option

Hourly rate distribution for jobs with a work from home option citing DV Cleared over the 6 months to 23 April 2024.

DV Cleared hourly rate histogram for jobs with a WFH option

DV Cleared
Co-occurring Skills and Capabilities with WFH Options by Category

The follow tables expand on the table above by listing co-occurrences grouped by category. The same employment type, locality and period is covered with up to 20 co-occurrences shown in each of the following categories:

Application Platforms
1 33 (6.82%) SharePoint
2 23 (4.75%) Confluence
3 21 (4.34%) Microsoft Exchange
4 17 (3.51%) SharePoint Server
5 1 (0.21%) Apache
5 1 (0.21%) Apache Spark
5 1 (0.21%) Skype for Business
Applications
1 8 (1.65%) Microsoft Excel
2 5 (1.03%) Microsoft PowerPoint
2 5 (1.03%) MS Visio
3 4 (0.83%) Microsoft Office
4 3 (0.62%) Microsoft Project
5 1 (0.21%) Siemens NX
5 1 (0.21%) Spreadsheet
Business Applications
1 7 (1.45%) Dynamics CRM
2 6 (1.24%) Primavera
3 4 (0.83%) SAP S/4HANA
3 4 (0.83%) Sparx Enterprise Architect
4 2 (0.41%) SAP EWM
4 2 (0.41%) SAP QM
5 1 (0.21%) Oracle Financials
5 1 (0.21%) Oracle General Ledger
5 1 (0.21%) SAP PP
Cloud Services
1 79 (16.32%) Azure
2 55 (11.36%) AWS
3 26 (5.37%) Microsoft 365
4 20 (4.13%) Entra ID
5 18 (3.72%) Azure Stack
6 15 (3.10%) Azure Monitor
6 15 (3.10%) Azure Storage
7 11 (2.27%) Power Platform
8 7 (1.45%) Dynamics 365
9 5 (1.03%) Azure DevOps
10 4 (0.83%) Lucidchart
11 3 (0.62%) Azure Sentinel
11 3 (0.62%) OneDrive
11 3 (0.62%) SaaS
12 2 (0.41%) GCP
13 1 (0.21%) AWS CloudFormation
13 1 (0.21%) Google Workspace
13 1 (0.21%) OpenShift
13 1 (0.21%) Rubrik
Communications & Networking
1 79 (16.32%) Firewall
2 22 (4.55%) SSL
3 21 (4.34%) BGP
3 21 (4.34%) DNS
4 20 (4.13%) DHCP
5 19 (3.93%) TCP/IP
6 15 (3.10%) SAN
7 13 (2.69%) Network Security
8 11 (2.27%) Intrusion Detection
9 9 (1.86%) 4G
10 8 (1.65%) 3G
11 7 (1.45%) WAN
12 5 (1.03%) Cisco ISE
13 4 (0.83%) Junos
13 4 (0.83%) OSPF
13 4 (0.83%) SDH
14 3 (0.62%) LAN
14 3 (0.62%) MPLS
15 2 (0.41%) EIGRP
15 2 (0.41%) RIP
Database & Business Intelligence
1 20 (4.13%) Elasticsearch
2 9 (1.86%) PostgreSQL
2 9 (1.86%) SQL Server
3 6 (1.24%) Amazon RDS
4 2 (0.41%) NoSQL
4 2 (0.41%) Power BI
4 2 (0.41%) SQL Server Integration Services
4 2 (0.41%) SQL Server Reporting Services
5 1 (0.21%) Big Data
5 1 (0.21%) Biml
5 1 (0.21%) Geospatial Data
5 1 (0.21%) Hadoop
5 1 (0.21%) MySQL
5 1 (0.21%) RDBMS
5 1 (0.21%) Relational Database
5 1 (0.21%) SQLite
Development Applications
1 26 (5.37%) JIRA
2 8 (1.65%) TestRail
3 6 (1.24%) Git
4 5 (1.03%) GitLab
4 5 (1.03%) Jenkins
5 4 (0.83%) Bitbucket
5 4 (0.83%) Rational DOORS
6 2 (0.41%) Cypress.io
6 2 (0.41%) JIRA Agile
6 2 (0.41%) Selenium
7 1 (0.21%) Axure RP
7 1 (0.21%) Checkstyle
7 1 (0.21%) SonarQube
General
1 87 (17.98%) Social Skills
2 76 (15.70%) Public Sector
3 40 (8.26%) Finance
4 26 (5.37%) Telecoms
5 24 (4.96%) Manufacturing
6 19 (3.93%) Analytical Skills
7 18 (3.72%) Electronics
7 18 (3.72%) Marketing
8 15 (3.10%) Military
9 13 (2.69%) Presentation Skills
10 8 (1.65%) Aerospace
11 4 (0.83%) Aeronautics
11 4 (0.83%) Aviation
11 4 (0.83%) Influencing Skills
11 4 (0.83%) Organisational Skills
12 3 (0.62%) Inclusion and Diversity
12 3 (0.62%) Local Government
13 2 (0.41%) Advertising
13 2 (0.41%) Documentation Skills
13 2 (0.41%) Public Speaking
Job Titles
1 104 (21.49%) Architect
2 34 (7.02%) Senior
3 33 (6.82%) Analyst
4 28 (5.79%) Consultant
5 27 (5.58%) Developer
5 27 (5.58%) Security Architect
6 23 (4.75%) Solutions Architect
7 21 (4.34%) Lead
7 21 (4.34%) Project Manager
8 17 (3.51%) Microsoft Engineer
9 16 (3.31%) Python Developer
9 16 (3.31%) SIEM Engineer
10 15 (3.10%) Azure Specialist
11 14 (2.89%) Active Directory Specialist
11 14 (2.89%) Active Directory Support
11 14 (2.89%) Network Engineer
11 14 (2.89%) Support Specialist
12 12 (2.48%) Test Analyst
13 11 (2.27%) Business Analyst
13 11 (2.27%) Technical Architect
Libraries, Frameworks & Software Standards
1 20 (4.13%) Web Services
2 15 (3.10%) ARM Templates
3 6 (1.24%) React
3 6 (1.24%) Spring
3 6 (1.24%) Spring Boot
4 4 (0.83%) Node.js
4 4 (0.83%) RESTful
5 3 (0.62%) .NET
5 3 (0.62%) .NET Core
5 3 (0.62%) Elastic Stack
5 3 (0.62%) PyTorch
5 3 (0.62%) scikit-learn
5 3 (0.62%) TensorFlow
6 2 (0.41%) Lucene
7 1 (0.21%) CSS
7 1 (0.21%) HTML
7 1 (0.21%) Kafka
7 1 (0.21%) LDAP
7 1 (0.21%) SignalR
7 1 (0.21%) XML
Miscellaneous
1 46 (9.50%) PKI
2 18 (3.72%) Private Cloud
3 17 (3.51%) Virtual Team
4 16 (3.31%) Self-Motivation
5 13 (2.69%) Management Information System
6 12 (2.48%) Data Centre
7 9 (1.86%) Cyber Threat
8 4 (0.83%) Algorithms
8 4 (0.83%) Analytical Mindset
8 4 (0.83%) CMDB
8 4 (0.83%) Smartphone
9 3 (0.62%) Cyber Defence
9 3 (0.62%) Cyber Kill Chain
9 3 (0.62%) Security Posture
10 2 (0.41%) Distributed Systems
10 2 (0.41%) Onboarding
11 1 (0.21%) Cloud Native
11 1 (0.21%) CSOC
11 1 (0.21%) Greenfield Project
11 1 (0.21%) Linux Command Line
Operating Systems
1 70 (14.46%) Linux
2 56 (11.57%) Windows
3 22 (4.55%) Windows Server
4 16 (3.31%) Ubuntu
4 16 (3.31%) Windows Server 2016
4 16 (3.31%) Windows Server 2019
5 15 (3.10%) Debian
6 5 (1.03%) Apple iOS
7 4 (0.83%) Windows 10
8 1 (0.21%) Red Hat Enterprise Linux
8 1 (0.21%) Windows Server 2012
Processes & Methodologies
1 99 (20.45%) Agile
2 77 (15.91%) ITIL
3 52 (10.74%) Service Management
4 48 (9.92%) DevOps
5 45 (9.30%) Cybersecurity
6 37 (7.64%) Problem-Solving
7 31 (6.40%) ITSM
7 31 (6.40%) Project Management
8 29 (5.99%) Cryptography
9 28 (5.79%) Project Delivery
10 27 (5.58%) CI/CD
10 27 (5.58%) SIEM
11 23 (4.75%) Programme Management
11 23 (4.75%) Security Architecture
12 22 (4.55%) Analytics
12 22 (4.55%) Decision-Making
12 22 (4.55%) Software Engineering
13 20 (4.13%) Business Intelligence
13 20 (4.13%) Key Management
13 20 (4.13%) Stakeholder Management
Programming Languages
1 38 (7.85%) Python
2 28 (5.79%) C#
3 25 (5.17%) JavaScript
3 25 (5.17%) PowerShell
4 22 (4.55%) SQL
5 16 (3.31%) Bash
6 15 (3.10%) VB
6 15 (3.10%) VBScript
7 14 (2.89%) Bicep
7 14 (2.89%) Java
8 13 (2.69%) C
9 6 (1.24%) TypeScript
10 1 (0.21%) Ada
10 1 (0.21%) C++
10 1 (0.21%) Go
10 1 (0.21%) Perl
10 1 (0.21%) PL/SQL
10 1 (0.21%) Rust
Qualifications
1 484 (100.00%) Security Cleared
2 192 (39.67%) SC Cleared
3 52 (10.74%) Degree
4 15 (3.10%) ITIL Foundation Certificate
5 12 (2.48%) ISTQB
6 10 (2.07%) CISM
7 9 (1.86%) Cisco Certification
8 8 (1.65%) CCNP
8 8 (1.65%) CISSP
8 8 (1.65%) ISTQB Foundation Certification
9 7 (1.45%) PMI Certification
9 7 (1.45%) PMP
10 6 (1.24%) HND
11 5 (1.03%) AWS Certification
11 5 (1.03%) TOGAF Certification
12 4 (0.83%) Azure Certification
12 4 (0.83%) JNCIA
12 4 (0.83%) PRINCE2 Certification
13 3 (0.62%) CCNA
13 3 (0.62%) CTC Cleared
Quality Assurance & Compliance
1 17 (3.51%) Government Security Classifications
1 17 (3.51%) NIST
2 15 (3.10%) ISO/IEC 27001
3 11 (2.27%) QA
4 9 (1.86%) NCSC
5 7 (1.45%) PMO
6 4 (0.83%) SLA
7 3 (0.62%) GDPR
7 3 (0.62%) NIST 800
7 3 (0.62%) RMADS
8 2 (0.41%) Data Quality
8 2 (0.41%) JSP 440
9 1 (0.21%) DO-178B
9 1 (0.21%) GxP
9 1 (0.21%) IEC 61508
9 1 (0.21%) IFRS
9 1 (0.21%) ISO/IEC 27005
System Software
1 53 (10.95%) Active Directory
2 20 (4.13%) Docker
3 15 (3.10%) Virtual Desktop
3 15 (3.10%) Virtual Machines
4 9 (1.86%) VMware NSX
5 5 (1.03%) vSphere
6 4 (0.83%) VMware ESXi
7 2 (0.41%) VMware Infrastructure
8 1 (0.21%) Citrix Hypervisor
8 1 (0.21%) UAG
Systems Management
1 33 (6.82%) Kubernetes
2 32 (6.61%) SCOM
3 20 (4.13%) Active Directory Federation Services
3 20 (4.13%) Microsoft Intune
4 16 (3.31%) WSUS
5 15 (3.10%) Ansible
5 15 (3.10%) SCCM
6 12 (2.48%) Terraform
7 4 (0.83%) Kibana
7 4 (0.83%) Prometheus
8 3 (0.62%) Nagios
9 2 (0.41%) Docker Swarm
9 2 (0.41%) Nessus
10 1 (0.21%) Argo
10 1 (0.21%) Grafana
10 1 (0.21%) Progress Chef
10 1 (0.21%) Puppet
Vendors
1 107 (22.11%) Microsoft
2 30 (6.20%) VMware
3 24 (4.96%) SAP
4 22 (4.55%) Atlassian
5 21 (4.34%) Dell
6 16 (3.31%) Red Hat
7 15 (3.10%) Cisco
8 9 (1.86%) Juniper
9 8 (1.65%) CyberArk
9 8 (1.65%) Palo Alto
9 8 (1.65%) Sparx
9 8 (1.65%) Splunk
10 7 (1.45%) Oracle
11 5 (1.03%) Apple
12 4 (0.83%) BiZZdesign
12 4 (0.83%) Ciena
12 4 (0.83%) IBM
12 4 (0.83%) Nokia
13 3 (0.62%) Commvault
13 3 (0.62%) Siemens