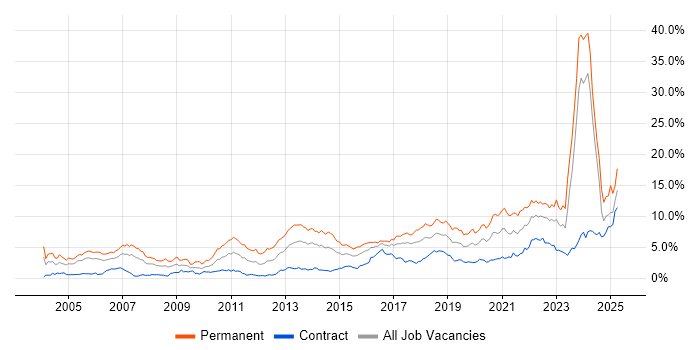
Software Engineering Jobs in Glasgow

Software Engineering
Scotland > Glasgow

The table below provides summary statistics for permanent job vacancies advertised in Glasgow requiring Software Engineering skills. It includes a benchmarking guide to the annual salaries offered in vacancies that cited Software Engineering over the 6 months leading up to 4 July 2025, comparing them to the same period in the previous two years.

6 months to
4 Jul 2025
Same period 2024 Same period 2023
Rank 3 5 14
Rank change year-on-year +2 +9 +2
Permanent jobs citing Software Engineering 244 2,001 198
As % of all permanent jobs advertised in Glasgow 32.32% 56.18% 13.41%
As % of the Processes & Methodologies category 36.31% 59.43% 13.76%
Number of salaries quoted 48 119 81
10th Percentile £54,250 £24,000 £41,250
25th Percentile £55,801 £41,250 £45,000
Median annual salary (50th Percentile) £61,250 £60,000 £57,500
Median % change year-on-year +2.08% +4.35% -
75th Percentile £77,500 £73,750 £71,250
90th Percentile £89,500 £80,000 £73,750
Scotland median annual salary £58,033 £60,000 £62,000
% change year-on-year -3.28% -3.23% +3.33%

All Process and Methodology Skills
Glasgow

Software Engineering falls under the Processes and Methodologies category. For comparison with the information above, the following table provides summary statistics for all permanent job vacancies requiring process or methodology skills in Glasgow.

Permanent vacancies with a requirement for process or methodology skills 672 3,367 1,439
As % of all permanent jobs advertised in Glasgow 89.01% 94.53% 97.49%
Number of salaries quoted 287 891 646
10th Percentile £30,600 £30,750 £32,938
25th Percentile £37,500 £41,250 £42,500
Median annual salary (50th Percentile) £58,033 £54,000 £55,000
Median % change year-on-year +7.47% -1.82% +10.00%
75th Percentile £73,750 £66,250 £67,875
90th Percentile £85,000 £80,000 £75,000
Scotland median annual salary £51,645 £52,500 £55,000
% change year-on-year -1.63% -4.55% -

Software Engineering
Job Vacancy Trend in Glasgow

Job postings citing Software Engineering as a proportion of all IT jobs advertised in Glasgow.

Job vacancy trend for Software Engineering in Glasgow

Software Engineering
Salary Trend in Glasgow

3-month moving average salary quoted in jobs citing Software Engineering in Glasgow.

Salary trend for Software Engineering in Glasgow

Software Engineering
Salary Histogram in Glasgow

Salary distribution for jobs citing Software Engineering in Glasgow over the 6 months to 4 July 2025.

Salary histogram for Software Engineering in Glasgow

Software Engineering
Co-occurring Skills and Capabilities in Glasgow by Category

The follow tables expand on the table above by listing co-occurrences grouped by category. The same employment type, locality and period is covered with up to 20 co-occurrences shown in each of the following categories:

Application Platforms
1 25 (10.25%) Apache Spark
2 13 (5.33%) Apache
3 8 (3.28%) Camunda
3 8 (3.28%) Oracle Workflow
4 4 (1.64%) Apache Airflow
4 4 (1.64%) Cloud Foundry
4 4 (1.64%) Tomcat
5 1 (0.41%) Confluence
5 1 (0.41%) Microsoft Exchange
5 1 (0.41%) SharePoint
Applications
1 21 (8.61%) Simulink
Cloud Services
1 90 (36.89%) AWS
2 34 (13.93%) Azure
3 18 (7.38%) GCP
4 15 (6.15%) Amazon S3
4 15 (6.15%) GitHub
5 10 (4.10%) AWS Lambda
5 10 (4.10%) Serverless
6 8 (3.28%) Amazon ECS
6 8 (3.28%) Azure DevOps
7 7 (2.87%) GitHub Actions
7 7 (2.87%) npm
7 7 (2.87%) Yarn
8 6 (2.46%) Amazon EC2
8 6 (2.46%) Amazon EKS
9 5 (2.05%) Azure Monitor
9 5 (2.05%) Cloud Computing
9 5 (2.05%) Microsoft 365
10 4 (1.64%) Amazon MSK
10 4 (1.64%) Azure AKS
10 4 (1.64%) Snowflake
Communications & Networking
1 1 (0.41%) HTTPS
1 1 (0.41%) Internet
Database & Business Intelligence
1 27 (11.07%) NoSQL
2 25 (10.25%) Big Data
3 19 (7.79%) Relational Database
4 17 (6.97%) Amazon Athena
5 16 (6.56%) Apache Cassandra
6 12 (4.92%) Elasticsearch
6 12 (4.92%) KDB
6 12 (4.92%) Kdb+
7 10 (4.10%) MongoDB
7 10 (4.10%) PostgreSQL
8 9 (3.69%) Amazon Redshift
8 9 (3.69%) Apache Hive
8 9 (3.69%) Apache Iceberg
9 8 (3.28%) Hadoop
9 8 (3.28%) RDBMS
10 7 (2.87%) Oracle Database
11 6 (2.46%) Amazon RDS
11 6 (2.46%) DynamoDB
11 6 (2.46%) SQL Server
12 5 (2.05%) HBase
Development Applications
1 19 (7.79%) Jenkins
2 17 (6.97%) Git
3 16 (6.56%) JUnit
4 15 (6.15%) Maven
5 8 (3.28%) Vite
5 8 (3.28%) webpack
6 7 (2.87%) Cypress.io
6 7 (2.87%) JIRA
7 5 (2.05%) Gradle
8 4 (1.64%) Subversion
9 2 (0.82%) GitLab
9 2 (0.82%) Selenium
10 1 (0.41%) Android Studio
10 1 (0.41%) Bitbucket
10 1 (0.41%) Jasmine
10 1 (0.41%) Karma Test Runner
10 1 (0.41%) Protractor
10 1 (0.41%) SonarQube
10 1 (0.41%) Sonatype Nexus
10 1 (0.41%) WebDriver
General
1 193 (79.10%) Finance
2 189 (77.46%) Inclusion and Diversity
3 186 (76.23%) Law
4 104 (42.62%) Banking
5 77 (31.56%) Marketing
6 30 (12.30%) Social Skills
7 23 (9.43%) Analytical Skills
8 17 (6.97%) Legal
9 16 (6.56%) Investment Banking
10 8 (3.28%) Private Banking
11 4 (1.64%) Front Office
11 4 (1.64%) Games
11 4 (1.64%) Publishing
12 3 (1.23%) Organisational Skills
13 1 (0.41%) Retail
Job Titles
1 204 (83.61%) Software Engineer
2 101 (41.39%) Java Engineer
3 100 (40.98%) Java Software Engineer
4 58 (23.77%) Lead
5 56 (22.95%) Lead Software Engineer
6 51 (20.90%) Full-Stack Engineer
6 51 (20.90%) Full-Stack Software Engineer
7 32 (13.11%) Python Engineer
7 32 (13.11%) Python Software Engineer
8 30 (12.30%) Senior
9 28 (11.48%) Senior Software Engineer
10 24 (9.84%) Lead Java Engineer
11 21 (8.61%) Systems Engineer
12 19 (7.79%) AWS Engineer
12 19 (7.79%) AWS Software Engineer
12 19 (7.79%) Developer
13 17 (6.97%) Java Developer
14 14 (5.74%) Developer/Software Engineer
14 14 (5.74%) Software Developer
15 13 (5.33%) Java Software Developer
Libraries, Frameworks & Software Standards
1 97 (39.75%) Spring
2 74 (30.33%) React
3 59 (24.18%) Kafka
4 54 (22.13%) Spring Boot
5 38 (15.57%) AngularJS
6 28 (11.48%) RESTful
7 27 (11.07%) REST
8 20 (8.20%) HTML
9 19 (7.79%) CSS
10 15 (6.15%) .NET
11 14 (5.74%) PySpark
12 13 (5.33%) Hibernate
12 13 (5.33%) Web Services
13 10 (4.10%) JPA
14 9 (3.69%) JDBC
14 9 (3.69%) Pandas
15 8 (3.28%) .NET Core
15 8 (3.28%) OpenAPI
15 8 (3.28%) Swagger
15 8 (3.28%) WSDL
Miscellaneous
1 78 (31.97%) Algorithms
2 54 (22.13%) Cloud Native
3 12 (4.92%) Distributed Systems
3 12 (4.92%) Public Cloud
4 11 (4.51%) Reference Data
5 8 (3.28%) Derivative
5 8 (3.28%) Fixed Income
6 5 (2.05%) Data Structures
6 5 (2.05%) Enterprise Software
6 5 (2.05%) Greenfield Project
6 5 (2.05%) Legacy Systems
7 4 (1.64%) Credit Risk
7 4 (1.64%) Distributed Applications
7 4 (1.64%) Equities
7 4 (1.64%) Foreign Exchange (FX)
7 4 (1.64%) Mobile App
7 4 (1.64%) Onboarding
8 2 (0.82%) Educational Technology
8 2 (0.82%) Product Ownership
9 1 (0.41%) AI Agents
Operating Systems
1 7 (2.87%) Apple iOS
2 6 (2.46%) Unix
3 5 (2.05%) Linux
4 4 (1.64%) Red Hat Enterprise Linux
4 4 (1.64%) Ubuntu
4 4 (1.64%) Windows
5 3 (1.23%) Mac OS
6 2 (0.82%) Android
Processes & Methodologies
1 191 (78.28%) Agile
2 160 (65.57%) SDLC
3 156 (63.93%) Operational Stability
4 150 (61.48%) CI/CD
5 113 (46.31%) Artificial Intelligence
6 107 (43.85%) Machine Learning
7 106 (43.44%) Community of Practice
8 79 (32.38%) Visualisation
9 70 (28.69%) Continuous Improvement
10 61 (25.00%) Full-Stack Development
11 52 (21.31%) Decision-Making
12 50 (20.49%) Problem-Solving
13 37 (15.16%) Mathematics
14 32 (13.11%) Architectural Design
14 32 (13.11%) Information Architecture
15 28 (11.48%) Microservices
16 23 (9.43%) TDD
17 22 (9.02%) DevOps
17 22 (9.02%) Risk Management
18 21 (8.61%) Continuous Delivery
Programming Languages
1 150 (61.48%) Java
2 70 (28.69%) SQL
3 61 (25.00%) Python
4 34 (13.93%) JavaScript
5 29 (11.89%) TypeScript
6 21 (8.61%) C#
6 21 (8.61%) MATLAB
7 10 (4.10%) C
7 10 (4.10%) C++
8 8 (3.28%) Objective-C
8 8 (3.28%) PL/SQL
9 6 (2.46%) Go
10 5 (2.05%) PowerShell
10 5 (2.05%) Scala
11 4 (1.64%) PHP
11 4 (1.64%) T-SQL
12 3 (1.23%) Swift
13 1 (0.41%) Bicep
13 1 (0.41%) Kotlin
13 1 (0.41%) Rust
Qualifications
1 27 (11.07%) Degree
2 21 (8.61%) HNC
2 21 (8.61%) HND
3 5 (2.05%) Azure Certification
3 5 (2.05%) Computer Science Degree
4 1 (0.41%) AWS Certification
Quality Assurance & Compliance
1 8 (3.28%) Data Quality
2 3 (1.23%) QA
3 1 (0.41%) Actionable Recommendations
3 1 (0.41%) ISO/IEC 27001
System Software
1 23 (9.43%) Docker
2 5 (2.05%) HDFS
Systems Management
1 59 (24.18%) Kubernetes
2 24 (9.84%) Terraform
3 16 (6.56%) Grafana
4 5 (2.05%) Ansible
5 4 (1.64%) ITRS Geneos
5 4 (1.64%) Netcool
5 4 (1.64%) Netcool/OMNIbus
5 4 (1.64%) Prometheus
5 4 (1.64%) Tivoli
6 2 (0.82%) Single Sign-On
7 1 (0.41%) Microsoft Intune
7 1 (0.41%) Progress Chef
Vendors
1 44 (18.03%) Oracle
2 24 (9.84%) Splunk
3 19 (7.79%) Dynatrace
4 14 (5.74%) Databricks
5 8 (3.28%) ServiceNow
6 6 (2.46%) Facebook
6 6 (2.46%) Google
7 5 (2.05%) Cloudera
7 5 (2.05%) Microsoft
8 4 (1.64%) IBM
8 4 (1.64%) Red Hat
8 4 (1.64%) Sybase
9 3 (1.23%) Murex
10 2 (0.82%) ForgeRock
10 2 (0.82%) Ping Identity
11 1 (0.41%) Solace