Azure Jobs in Glasgow

Microsoft Azure
Scotland > Glasgow

The table below provides summary statistics for permanent job vacancies advertised in Glasgow requiring Azure skills. It includes a benchmarking guide to the annual salaries offered in vacancies that cited Azure over the 6 months leading up to 15 October 2024, comparing them to the same period in the previous two years.

6 months to
15 Oct 2024
Same period 2023 Same period 2022
Rank 4 5 4
Rank change year-on-year +1 -1 0
Permanent jobs citing Azure 194 222 355
As % of all permanent jobs advertised in Glasgow 17.23% 22.49% 23.76%
As % of the Cloud Services category 48.38% 50.11% 58.20%
Number of salaries quoted 102 102 202
10th Percentile £36,250 £37,625 £34,162
25th Percentile £39,250 £46,250 £43,938
Median annual salary (50th Percentile) £55,000 £55,000 £55,000
Median % change year-on-year - - +4.76%
75th Percentile £67,500 £63,938 £67,500
90th Percentile £80,000 £73,000 £77,500
Scotland median annual salary £55,000 £55,000 £57,000
% change year-on-year - -3.51% +7.55%

All Cloud Skills
Glasgow

Azure falls under the Cloud Services category. For comparison with the information above, the following table provides summary statistics for all permanent job vacancies requiring cloud computing skills in Glasgow.

Permanent vacancies with a requirement for cloud computing skills 401 443 610
As % of all permanent jobs advertised in Glasgow 35.61% 44.88% 40.83%
Number of salaries quoted 184 252 351
10th Percentile £32,575 £25,800 £31,569
25th Percentile £38,375 £36,250 £39,000
Median annual salary (50th Percentile) £55,000 £52,500 £55,000
Median % change year-on-year +4.76% -4.55% +10.00%
75th Percentile £67,813 £63,813 £66,875
90th Percentile £80,000 £73,750 £80,000
Scotland median annual salary £55,000 £55,000 £55,000
% change year-on-year - - +10.00%

Azure
Job Vacancy Trend in Glasgow

Job postings citing Azure as a proportion of all IT jobs advertised in Glasgow.
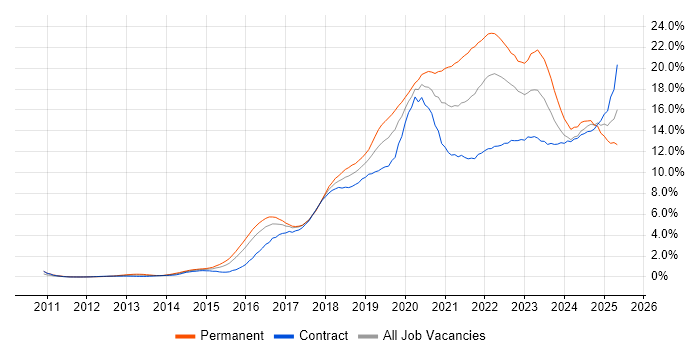
Job vacancy trend for Azure in Glasgow

Azure
Salary Trend in Glasgow

3-month moving average salary quoted in jobs citing Azure in Glasgow.

Salary trend for Azure in Glasgow

Azure
Salary Histogram in Glasgow

Salary distribution for jobs citing Azure in Glasgow over the 6 months to 15 October 2024.

Salary histogram for Azure in Glasgow

Azure
Co-occurring Skills and Capabilities in Glasgow by Category

The follow tables expand on the table above by listing co-occurrences grouped by category. The same employment type, locality and period is covered with up to 20 co-occurrences shown in each of the following categories:

Application Platforms
1 15 (7.73%) SharePoint
2 8 (4.12%) Microsoft Exchange
3 3 (1.55%) Apache Spark
3 3 (1.55%) Umbraco
4 2 (1.03%) Adobe Experience Manager
5 1 (0.52%) Apache
5 1 (0.52%) Cloud Foundry
Applications
1 6 (3.09%) Microsoft Office
2 4 (2.06%) Microsoft Excel
3 2 (1.03%) Oracle Smart View
Business Applications
1 8 (4.12%) Dynamics CRM
Cloud Services
1 59 (30.41%) AWS
2 35 (18.04%) Entra ID
3 33 (17.01%) Microsoft 365
4 28 (14.43%) GCP
5 26 (13.40%) Power Platform
6 23 (11.86%) SaaS
7 18 (9.28%) Azure DevOps
8 15 (7.73%) Dynamics 365
9 14 (7.22%) Azure Logic Apps
10 13 (6.70%) PowerApps
11 10 (5.15%) Azure Monitor
11 10 (5.15%) Microsoft Purview
12 9 (4.64%) Cloud Computing
13 8 (4.12%) Azure Cognitive Services
13 8 (4.12%) IaaS
13 8 (4.12%) PaaS
13 8 (4.12%) Serverless
14 7 (3.61%) GitHub
14 7 (3.61%) Power Automate
15 5 (2.58%) OneDrive
Communications & Networking
1 18 (9.28%) Firewall
2 6 (3.09%) VoIP
3 5 (2.58%) DHCP
3 5 (2.58%) DNS
4 3 (1.55%) IPsec
4 3 (1.55%) Kerberos
4 3 (1.55%) TCP/IP
5 2 (1.03%) VPN
6 1 (0.52%) Internet
Database & Business Intelligence
1 42 (21.65%) SQL Server
2 20 (10.31%) Power BI
3 17 (8.76%) Azure SQL Database
4 13 (6.70%) Data Warehouse
5 7 (3.61%) Data Lake
5 7 (3.61%) Geospatial Data
6 6 (3.09%) Data Vault
6 6 (3.09%) SQL Server Integration Services
6 6 (3.09%) SQL Server Reporting Services
7 4 (2.06%) Tableau
8 3 (1.55%) Amazon Athena
8 3 (1.55%) Amazon Redshift
8 3 (1.55%) Electronic Patient Records
8 3 (1.55%) Qlik Sense
9 2 (1.03%) Azure SQL Data Warehouse
9 2 (1.03%) Big Data
9 2 (1.03%) Hadoop
9 2 (1.03%) MySQL
9 2 (1.03%) Oracle BI Publisher
10 1 (0.52%) PostgreSQL
Development Applications
1 9 (4.64%) Git
2 5 (2.58%) JIRA
3 2 (1.03%) Jenkins
4 1 (0.52%) SonarQube
4 1 (0.52%) Terragrunt
General
1 47 (24.23%) Social Skills
2 42 (21.65%) Finance
3 23 (11.86%) Analytical Skills
4 19 (9.79%) Inclusion and Diversity
5 8 (4.12%) Law
5 8 (4.12%) Public Sector
6 6 (3.09%) Presentation Skills
7 4 (2.06%) Billing
7 4 (2.06%) Influencing Skills
7 4 (2.06%) Legal
7 4 (2.06%) Organisational Skills
8 2 (1.03%) Banking
8 2 (1.03%) Documentation Skills
8 2 (1.03%) Financial Institution
8 2 (1.03%) Marketing
8 2 (1.03%) Retail
9 1 (0.52%) Electronics
9 1 (0.52%) French Language
9 1 (0.52%) Games
9 1 (0.52%) Tech for Good
Job Titles
1 34 (17.53%) Developer
2 28 (14.43%) Software Engineer
3 24 (12.37%) Architect
3 24 (12.37%) Lead
4 22 (11.34%) Senior
5 14 (7.22%) .NET Developer
6 12 (6.19%) Senior Software Engineer
7 11 (5.67%) Cloud Engineer
7 11 (5.67%) Security Manager
8 10 (5.15%) Social Media Developer
9 9 (4.64%) CloudOps Engineer
9 9 (4.64%) Cybersecurity Manager
9 9 (4.64%) Operations Engineer
10 8 (4.12%) Consultant
10 8 (4.12%) Solutions Architect
11 7 (3.61%) Analyst
11 7 (3.61%) Applications Support
11 7 (3.61%) Geospatial Architect
11 7 (3.61%) Lead Software Engineer
11 7 (3.61%) Software Architect
Libraries, Frameworks & Software Standards
1 43 (22.16%) .NET
2 29 (14.95%) .NET Framework
3 23 (11.86%) .NET Core
4 20 (10.31%) Entity Framework
5 19 (9.79%) ASP.NET Web API
6 17 (8.76%) ASP.NET
7 14 (7.22%) Razor View Engine
8 12 (6.19%) ASP.NET MVC
9 11 (5.67%) CSS
10 9 (4.64%) React
11 8 (4.12%) HTML
12 7 (3.61%) AngularJS
13 6 (3.09%) JSON
14 5 (2.58%) ASP.NET Web Forms
14 5 (2.58%) HTML5
14 5 (2.58%) Vue
15 4 (2.06%) ADO
15 4 (2.06%) PySpark
16 3 (1.55%) RESTful
16 3 (1.55%) Web Services
Miscellaneous
1 13 (6.70%) Legacy Systems
2 10 (5.15%) Social Media
3 9 (4.64%) Data Centre
4 8 (4.12%) Cloud Native
5 7 (3.61%) Public Cloud
6 5 (2.58%) Onboarding
6 5 (2.58%) Product Ownership
7 4 (2.06%) Analytical Mindset
7 4 (2.06%) Greenfield Project
7 4 (2.06%) Management Information System
7 4 (2.06%) Private Cloud
7 4 (2.06%) Renewable Energy
8 3 (1.55%) Algorithms
8 3 (1.55%) Data Structures
8 3 (1.55%) Distributed Computing
8 3 (1.55%) Legacy Code
8 3 (1.55%) Mobile App
8 3 (1.55%) Self-Motivation
9 2 (1.03%) NHS
9 2 (1.03%) PMI
Operating Systems
1 34 (17.53%) Windows
2 19 (9.79%) Linux
2 19 (9.79%) Windows Server
3 5 (2.58%) Red Hat Enterprise Linux
4 4 (2.06%) CentOS
4 4 (2.06%) Ubuntu
5 2 (1.03%) Unix
6 1 (0.52%) Android
6 1 (0.52%) Apple iOS
6 1 (0.52%) Windows Server 2012
Processes & Methodologies
1 58 (29.90%) DevOps
2 45 (23.20%) Agile
3 37 (19.07%) Cybersecurity
3 37 (19.07%) Problem-Solving
4 33 (17.01%) Software Engineering
5 29 (14.95%) Full-Stack Development
6 28 (14.43%) Fintech
7 24 (12.37%) Infrastructure as Code
7 24 (12.37%) Project Management
8 23 (11.86%) Data Management
9 22 (11.34%) Business Intelligence
10 21 (10.82%) Analytics
11 20 (10.31%) CI/CD
12 19 (9.79%) Artificial Intelligence
12 19 (9.79%) Computer Science
13 18 (9.28%) Migration
13 18 (9.28%) MVC
13 18 (9.28%) SIEM
14 17 (8.76%) Security Operations
15 16 (8.25%) Mentoring
Programming Languages
1 51 (26.29%) C#
2 45 (23.20%) SQL
3 25 (12.89%) PowerShell
4 24 (12.37%) JavaScript
5 15 (7.73%) Python
6 10 (5.15%) Bash
6 10 (5.15%) Java
7 8 (4.12%) TypeScript
7 8 (4.12%) VB
8 3 (1.55%) T-SQL
9 2 (1.03%) Scala
10 1 (0.52%) C
10 1 (0.52%) C++
10 1 (0.52%) R
Qualifications
1 30 (15.46%) Degree
2 14 (7.22%) Microsoft Certification
3 13 (6.70%) Security Cleared
4 12 (6.19%) Computer Science Degree
5 11 (5.67%) AWS Certification
5 11 (5.67%) Azure Certification
6 10 (5.15%) SC Cleared
7 7 (3.61%) Master's Degree
8 6 (3.09%) ACCA
8 6 (3.09%) CISM
8 6 (3.09%) CISSP
8 6 (3.09%) TOGAF Certification
9 5 (2.58%) SSCP
10 4 (2.06%) CompTIA Security+
11 3 (1.55%) AWS Certified Cloud Practitioner
11 3 (1.55%) AWS Certified Solutions Architect
12 2 (1.03%) PMI Certification
Quality Assurance & Compliance
1 15 (7.73%) ISO/IEC 27001
2 6 (3.09%) GDPR
2 6 (3.09%) ISO 22301
2 6 (3.09%) NIST
3 2 (1.03%) Accessibility
3 2 (1.03%) Cyber Essentials
4 1 (0.52%) Data Quality
4 1 (0.52%) IEC 62304
4 1 (0.52%) NCSC
4 1 (0.52%) QA
4 1 (0.52%) SOC 2
System Software
1 42 (21.65%) Active Directory
2 8 (4.12%) Docker
2 8 (4.12%) Hyper-V
3 4 (2.06%) Virtual Machines
4 3 (1.55%) VMware ESXi
5 2 (1.03%) VMware Infrastructure
6 1 (0.52%) Virtual Desktop
6 1 (0.52%) vSphere
Systems Management
1 20 (10.31%) Kubernetes
1 20 (10.31%) Terraform
2 13 (6.70%) Ansible
3 9 (4.64%) Microsoft Intune
4 4 (2.06%) CASB
5 2 (1.03%) Single Sign-On
6 1 (0.52%) Galera Cluster
6 1 (0.52%) HAProxy
Vendors
1 78 (40.21%) Microsoft
2 13 (6.70%) VMware
3 11 (5.67%) Google
4 7 (3.61%) Databricks
4 7 (3.61%) ServiceNow
5 6 (3.09%) Sophos
6 3 (1.55%) Adobe
6 3 (1.55%) Alteryx
6 3 (1.55%) Cisco
6 3 (1.55%) Meraki
6 3 (1.55%) Optimizely
6 3 (1.55%) Oracle
6 3 (1.55%) Sitecore
6 3 (1.55%) Veeam
7 2 (1.03%) MuleSoft
7 2 (1.03%) Salesforce
8 1 (0.52%) Black Duck
8 1 (0.52%) Xamarin