Leader
South East > Hampshire
The median Leader salary in Hampshire is £60,000 per year, according to job vacancies posted during the 6 months leading to 30 May 2025.
The table below provides salary benchmarking and summary statistics, comparing them to the same period in the previous two years.
| 6 months to 30 May 2025 |
Same period 2024 | Same period 2023 | |
|---|---|---|---|
| Rank | 40 | 18 | 32 |
| Rank change year-on-year | -22 | +14 | +30 |
| Permanent jobs requiring a Lead | 94 | 373 | 187 |
| As % of all permanent jobs advertised in Hampshire | 4.75% | 8.82% | 6.67% |
| As % of the Job Titles category | 4.99% | 9.32% | 7.08% |
| Number of salaries quoted | 67 | 315 | 147 |
| 10th Percentile | £48,500 | £31,250 | £51,400 |
| 25th Percentile | £56,375 | £49,941 | £62,500 |
| Median annual salary (50th Percentile) | £60,000 | £60,000 | £75,000 |
| Median % change year-on-year | - | -20.00% | +7.26% |
| 75th Percentile | £68,750 | £75,000 | £81,875 |
| 90th Percentile | £78,500 | £92,500 | £85,000 |
| South East median annual salary | £70,000 | £62,084 | £67,500 |
| % change year-on-year | +12.75% | -8.02% | +2.27% |
All Permanent IT Job Vacancies
Hampshire
For comparison with the information above, the following table provides summary statistics for all permanent IT job vacancies in Hampshire. Most job vacancies include a discernible job title that can be normalized. As such, the figures in the second row provide an indication of the number of permanent jobs in our overall sample.
| Permanent vacancies in Hampshire with a recognized job title | 1,884 | 4,002 | 2,641 |
| % of permanent jobs with a recognized job title | 95.20% | 94.68% | 94.25% |
| Number of salaries quoted | 1,130 | 3,115 | 1,968 |
| 10th Percentile | £30,000 | £27,000 | £28,500 |
| 25th Percentile | £41,250 | £37,500 | £37,500 |
| Median annual salary (50th Percentile) | £52,500 | £50,000 | £53,500 |
| Median % change year-on-year | +5.00% | -6.54% | +1.90% |
| 75th Percentile | £65,000 | £65,000 | £70,000 |
| 90th Percentile | £78,750 | £75,000 | £80,725 |
| South East median annual salary | £55,000 | £50,000 | £55,000 |
| % change year-on-year | +10.00% | -9.09% | - |
Lead
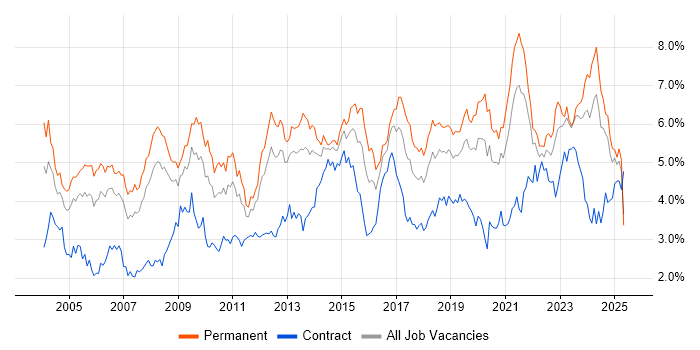
Job Vacancy Trend in Hampshire
Job postings that featured Lead in the job title as a proportion of all IT jobs advertised in Hampshire.

Lead
Salary Trend in Hampshire
3-month moving average salary quoted in jobs citing Lead in Hampshire.
Lead
Salary Histogram in Hampshire
Salary distribution for jobs citing Lead in Hampshire over the 6 months to 30 May 2025.
Lead
Job Locations in Hampshire
The table below looks at the demand and provides a guide to the median salaries quoted in IT jobs citing Lead within the Hampshire region over the 6 months to 30 May 2025. The 'Rank Change' column provides an indication of the change in demand within each location based on the same 6 month period last year.
| Location | Rank Change on Same Period Last Year |
Matching Permanent IT Job Ads |
Median Salary Past 6 Months |
Median Salary % Change on Same Period Last Year |
Live Jobs |
|---|---|---|---|---|---|
| Portsmouth | -23 | 23 | £56,250 | +2.27% | 90 |
| Southampton | -4 | 14 | £60,000 | +9.09% | 92 |
| Basingstoke | -6 | 13 | £62,875 | -16.17% | 91 |
| Farnborough | -7 | 11 | £67,500 | -6.90% | 1 |
| Fareham | -4 | 10 | £50,000 | -25.93% | 1 |
| Andover | - | 8 | £67,500 | - | |
| Waterlooville | - | 4 | £60,000 | - | |
| Petersfield | -3 | 3 | £60,000 | +4.35% | |
| Gosport | -13 | 3 | £60,000 | +3.45% | |
| Southsea | - | 3 | £60,000 | - | |
| Yateley | +3 | 1 | £70,000 | - | 1 |
| Lead South East |
|||||
Lead Skill Set
Top 30 Co-occurring Skills and Capabilities in Hampshire
For the 6 months to 30 May 2025, Lead job roles required the following skills and capabilities in order of popularity. The figures indicate the absolute number co-occurrences and as a proportion of all permanent job ads across the Hampshire region featuring Lead in the job title.
|
|
Lead Skill Set
Co-occurring Skills and Capabilities in Hampshire by Category
The follow tables expand on the table above by listing co-occurrences grouped by category. The same employment type, locality and period is covered with up to 20 co-occurrences shown in each of the following categories:
|
|
||||||||||||||||||||||||||||||||||||||||||||||||||||||||||||||||||||||||||||||||||||||||||||||||||||||||||||||||||||||||
|
|
||||||||||||||||||||||||||||||||||||||||||||||||||||||||||||||||||||||||||||||||||||||||||||||||||||||||||||||||||||||||
|
|
||||||||||||||||||||||||||||||||||||||||||||||||||||||||||||||||||||||||||||||||||||||||||||||||||||||||||||||||||||||||
|
|
||||||||||||||||||||||||||||||||||||||||||||||||||||||||||||||||||||||||||||||||||||||||||||||||||||||||||||||||||||||||
|
|
||||||||||||||||||||||||||||||||||||||||||||||||||||||||||||||||||||||||||||||||||||||||||||||||||||||||||||||||||||||||
|
|
||||||||||||||||||||||||||||||||||||||||||||||||||||||||||||||||||||||||||||||||||||||||||||||||||||||||||||||||||||||||
|
|
||||||||||||||||||||||||||||||||||||||||||||||||||||||||||||||||||||||||||||||||||||||||||||||||||||||||||||||||||||||||
|
|
||||||||||||||||||||||||||||||||||||||||||||||||||||||||||||||||||||||||||||||||||||||||||||||||||||||||||||||||||||||||
|
|
||||||||||||||||||||||||||||||||||||||||||||||||||||||||||||||||||||||||||||||||||||||||||||||||||||||||||||||||||||||||
