Lead Jobs in the South East

Leader
England > South East

The median Leader salary in the South East is £62,334 per year, according to job vacancies posted during the 6 months leading to 26 July 2024.

The table below provides salary benchmarking and summary statistics, comparing them to the same period in the previous two years.

6 months to
26 Jul 2024
Same period 2023 Same period 2022
Rank 23 47 41
Rank change year-on-year +24 -6 -6
Permanent jobs requiring a Lead 1,092 652 1,399
As % of all permanent jobs advertised in the South East 7.24% 5.63% 6.34%
As % of the Job Titles category 7.68% 6.15% 6.64%
Number of salaries quoted 758 507 869
10th Percentile £36,750 £45,000 £45,000
25th Percentile £47,500 £53,750 £53,750
Median annual salary (50th Percentile) £62,334 £65,000 £67,500
Median % change year-on-year -4.10% -3.70% +8.00%
75th Percentile £79,688 £77,500 £81,250
90th Percentile £92,500 £92,500 £87,500
England median annual salary £70,000 £72,500 £75,000
% change year-on-year -3.45% -3.33% +7.14%

All Permanent IT Job Vacancies
South East

For comparison with the information above, the following table provides summary statistics for all permanent IT job vacancies in the South East. Most job vacancies include a discernible job title that can be normalized. As such, the figures in the second row provide an indication of the number of permanent jobs in our overall sample.

Permanent vacancies in the South East with a recognized job title 14,224 10,599 21,077
% of permanent jobs with a recognized job title 94.24% 91.47% 95.52%
Number of salaries quoted 9,733 7,232 12,510
10th Percentile £29,000 £30,000 £30,000
25th Percentile £37,500 £40,000 £40,463
Median annual salary (50th Percentile) £50,000 £55,000 £55,000
Median % change year-on-year -9.09% - +10.00%
75th Percentile £65,000 £70,000 £70,000
90th Percentile £80,000 £83,750 £82,500
England median annual salary £55,000 £60,000 £60,000
% change year-on-year -8.33% - +9.09%

Lead
Job Vacancy Trend in the South East

Job postings that featured Lead in the job title as a proportion of all IT jobs advertised in the South East.
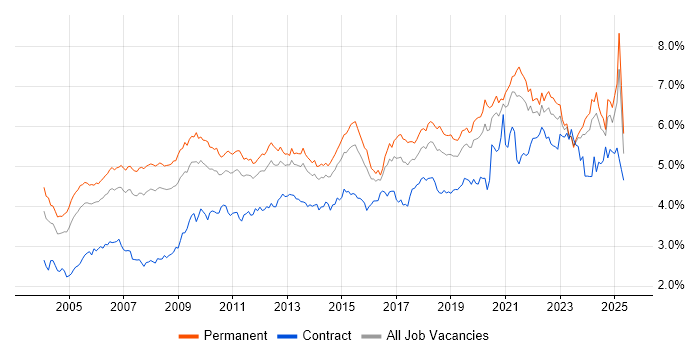
Job vacancy trend for Lead in the South East

Lead
Salary Trend in the South East

3-month moving average salary quoted in jobs citing Lead in the South East.

Salary trend for Lead in the South East

Lead
Salary Histogram in the South East

Salary distribution for jobs citing Lead in the South East over the 6 months to 26 July 2024.

Salary histogram for Lead in the South East

Lead
Job Locations in the South East

The table below looks at the demand and provides a guide to the median salaries quoted in IT jobs citing Lead within the South East region over the 6 months to 26 July 2024. The 'Rank Change' column provides an indication of the change in demand within each location based on the same 6 month period last year.

Location Rank Change
on Same Period
Last Year
Matching
Permanent
IT Job Ads
Median Salary
Past 6 Months
Median Salary
% Change
on Same Period
Last Year
Live
Jobs
Thames Valley +34 411 £63,000 -3.08% 40
Hampshire +18 333 £60,000 -17.24% 32
Berkshire +45 228 £75,000 +7.14% 22
Surrey -9 126 £60,000 -7.69% 13
Buckinghamshire +50 105 £55,000 -12.00% 11
Kent +24 98 £50,000 -13.04% 16
Oxfordshire -17 78 £52,500 -8.70% 7
West Sussex +27 55 £70,000 +21.74% 7
East Sussex +7 24 £73,805 +18.09% 4
Middlesex -7 22 £44,658 -33.84%
Sussex -9 17 £40,000 -52.94%
Lead
England

Lead Skill Set
Top 30 Co-occurring Skills and Capabilities in the South East

For the 6 months to 26 July 2024, Lead job roles required the following skills and capabilities in order of popularity. The figures indicate the absolute number co-occurrences and as a proportion of all permanent job ads across the South East region featuring Lead in the job title.

1 215 (19.69%) Social Skills
2 173 (15.84%) Agile
3 163 (14.93%) Software Engineering
4 148 (13.55%) Finance
4 148 (13.55%) Problem-Solving
5 144 (13.19%) Mentoring
6 138 (12.64%) Microsoft
7 137 (12.55%) Analytics
8 136 (12.45%) Azure
9 132 (12.09%) Degree
10 125 (11.45%) Windows
11 122 (11.17%) .NET
12 109 (9.98%) Process Improvement
13 108 (9.89%) AWS
14 107 (9.80%) C#
15 106 (9.71%) JavaScript
16 100 (9.16%) SQL
16 100 (9.16%) Project Management
17 94 (8.61%) Marketing
18 91 (8.33%) Data Strategy
19 85 (7.78%) Use Case
20 82 (7.51%) Matrix Organization
21 81 (7.42%) Business Case
22 79 (7.23%) Java
22 79 (7.23%) Data Collection
23 78 (7.14%) Digital Marketing
23 78 (7.14%) Regulatory Change
23 78 (7.14%) DevOps
24 77 (7.05%) Marketing Technology
24 77 (7.05%) Broadband

Lead Skill Set
Co-occurring Skills and Capabilities in the South East by Category

The follow tables expand on the table above by listing co-occurrences grouped by category. The same employment type, locality and period is covered with up to 20 co-occurrences shown in each of the following categories:

Application Platforms
1 18 (1.65%) SharePoint
2 10 (0.92%) OpenStack
3 7 (0.64%) Microsoft Exchange
4 6 (0.55%) CMS
5 5 (0.46%) Apache
5 5 (0.46%) SAS
6 4 (0.37%) IIS
6 4 (0.37%) WebLogic
7 3 (0.27%) Apache Spark
8 2 (0.18%) Confluence
9 1 (0.092%) Drupal
Applications
1 52 (4.76%) Microsoft Excel
2 12 (1.10%) Microsoft Office
3 8 (0.73%) Microsoft PowerPoint
4 3 (0.27%) MS Visio
5 2 (0.18%) SPSS
6 1 (0.092%) MadCap Flare
6 1 (0.092%) Simulink
6 1 (0.092%) Spreadsheet
Business Applications
1 18 (1.65%) Dynamics CRM
2 10 (0.92%) SAP GRC
3 8 (0.73%) SAP S/4HANA
4 4 (0.37%) Q-Pulse
4 4 (0.37%) Sparx Enterprise Architect
5 3 (0.27%) OpenText VIM for SAP
5 3 (0.27%) SAP BPC
6 2 (0.18%) SAP HR
7 1 (0.092%) SAP CO
7 1 (0.092%) SAP ERP
7 1 (0.092%) SAP FI
7 1 (0.092%) SAP FI/CO
7 1 (0.092%) SAP QM
Cloud Services
1 136 (12.45%) Azure
2 108 (9.89%) AWS
3 54 (4.95%) Power Platform
4 37 (3.39%) Microsoft 365
5 28 (2.56%) SaaS
6 22 (2.01%) Azure DevOps
7 20 (1.83%) Serverless
8 19 (1.74%) Dynamics 365
9 15 (1.37%) Amazon ECS
9 15 (1.37%) Entra ID
10 14 (1.28%) Amazon S3
11 13 (1.19%) Amazon EKS
11 13 (1.19%) GCP
12 11 (1.01%) Amazon SQS
12 11 (1.01%) AWS Lambda
13 8 (0.73%) GitHub
13 8 (0.73%) PaaS
14 7 (0.64%) Pulumi
14 7 (0.64%) Snowflake
15 6 (0.55%) Azure AKS
Communications & Networking
1 77 (7.05%) Broadband
2 39 (3.57%) Firewall
3 21 (1.92%) DNS
4 16 (1.47%) TCP/IP
5 15 (1.37%) Network Security
6 12 (1.10%) SSL
7 7 (0.64%) DHCP
7 7 (0.64%) LAN
8 6 (0.55%) VoIP
8 6 (0.55%) VPN
8 6 (0.55%) WAN
8 6 (0.55%) Wireless
9 5 (0.46%) Radio Access Network
9 5 (0.46%) SMTP
10 4 (0.37%) CTI
10 4 (0.37%) HTTP
10 4 (0.37%) RS-232
10 4 (0.37%) RS-485
10 4 (0.37%) VLAN
10 4 (0.37%) Wireshark
Database & Business Intelligence
1 44 (4.03%) NoSQL
1 44 (4.03%) Power BI
2 42 (3.85%) SQL Server
3 13 (1.19%) SQL Server Reporting Services
4 11 (1.01%) Amazon RDS
4 11 (1.01%) Data Warehouse
4 11 (1.01%) Oracle Database
5 9 (0.82%) MySQL
6 8 (0.73%) Relational Database
7 7 (0.64%) PostgreSQL
8 6 (0.55%) DB2
9 5 (0.46%) Azure SQL Database
9 5 (0.46%) Oracle Database 12c
9 5 (0.46%) RDBMS
9 5 (0.46%) SQL Server Integration Services
10 3 (0.27%) Data Mining
10 3 (0.27%) SAP BW
11 2 (0.18%) Amazon Redshift
11 2 (0.18%) Hadoop
11 2 (0.18%) Tableau
Development Applications
1 49 (4.49%) Git
2 33 (3.02%) Selenium
2 33 (3.02%) Visual Studio
3 26 (2.38%) Cypress.io
4 24 (2.20%) SoapUI
5 13 (1.19%) GitLab
5 13 (1.19%) Team Foundation Server
6 10 (0.92%) JIRA
6 10 (0.92%) Visual Studio Code
7 8 (0.73%) TeamCity
8 7 (0.64%) Jasmine
8 7 (0.64%) NUnit
8 7 (0.64%) Postman
9 5 (0.46%) Jenkins
10 4 (0.37%) Android Studio
10 4 (0.37%) Xcode
11 3 (0.27%) SQL Server Management Studio (SSMS)
12 2 (0.18%) Rational DOORS
12 2 (0.18%) Robot Framework
12 2 (0.18%) Subversion
General
1 215 (19.69%) Social Skills
2 148 (13.55%) Finance
3 94 (8.61%) Marketing
4 77 (7.05%) Advertising
5 74 (6.78%) Analytical Skills
6 38 (3.48%) Inclusion and Diversity
7 32 (2.93%) Manufacturing
7 32 (2.93%) Public Sector
8 29 (2.66%) Automotive
9 24 (2.20%) Legal
9 24 (2.20%) Telecoms
10 22 (2.01%) Organisational Skills
10 22 (2.01%) Presentation Skills
11 21 (1.92%) Retail
12 17 (1.56%) Aviation
13 14 (1.28%) Electronics
14 12 (1.10%) Military
15 11 (1.01%) Aerospace
15 11 (1.01%) Law
16 10 (0.92%) Banking
Libraries, Frameworks & Software Standards
1 122 (11.17%) .NET
2 67 (6.14%) React
3 45 (4.12%) CSS
4 37 (3.39%) HTML
5 25 (2.29%) ASP.NET
6 21 (1.92%) Jest
7 18 (1.65%) JSON
8 17 (1.56%) .NET Framework
9 16 (1.47%) .NET Core
10 12 (1.10%) Django
11 11 (1.01%) XML
12 10 (0.92%) AngularJS
13 9 (0.82%) ASP.NET MVC
13 9 (0.82%) EDI
13 9 (0.82%) REST
13 9 (0.82%) RESTful
13 9 (0.82%) Tailwind CSS
14 8 (0.73%) Entity Framework
14 8 (0.73%) RabbitMQ
15 7 (0.64%) OpenID
Miscellaneous
1 77 (7.05%) Marketing Technology
2 31 (2.84%) Data Centre
3 30 (2.75%) Self-Motivation
4 28 (2.56%) Management Information System
5 22 (2.01%) Greenfield Project
6 16 (1.47%) Onboarding
7 15 (1.37%) Life Science
8 14 (1.28%) Algorithms
9 13 (1.19%) Analytical Mindset
9 13 (1.19%) Digital Media
10 12 (1.10%) Augmented Reality
10 12 (1.10%) Mobile App
10 12 (1.10%) Product Ownership
11 10 (0.92%) Renewable Energy
12 9 (0.82%) Credit Risk
12 9 (0.82%) Enterprise Software
12 9 (0.82%) Fibre Optics
12 9 (0.82%) Public Cloud
13 8 (0.73%) Cyber Threat
13 8 (0.73%) IoT
Operating Systems
1 125 (11.45%) Windows
2 67 (6.14%) Linux
3 32 (2.93%) Windows Server
4 21 (1.92%) Windows 10
5 8 (0.73%) Android
6 5 (0.46%) Red Hat Enterprise Linux
6 5 (0.46%) Unix
7 4 (0.37%) Windows Server 2019
8 3 (0.27%) CentOS
8 3 (0.27%) Rocky
8 3 (0.27%) Windows Server 2016
9 2 (0.18%) Mac OS
9 2 (0.18%) Windows 7
10 1 (0.092%) Embedded Linux
10 1 (0.092%) VxWorks
10 1 (0.092%) Windows 8
10 1 (0.092%) Windows Server 2012
Processes & Methodologies
1 173 (15.84%) Agile
2 163 (14.93%) Software Engineering
3 148 (13.55%) Problem-Solving
4 144 (13.19%) Mentoring
5 137 (12.55%) Analytics
6 109 (9.98%) Process Improvement
7 100 (9.16%) Project Management
8 91 (8.33%) Data Strategy
9 85 (7.78%) Use Case
10 82 (7.51%) Matrix Organization
11 81 (7.42%) Business Case
12 79 (7.23%) Data Collection
13 78 (7.14%) DevOps
13 78 (7.14%) Digital Marketing
13 78 (7.14%) Regulatory Change
14 74 (6.78%) Continuous Improvement
15 70 (6.41%) Coaching
16 69 (6.32%) ITIL
17 68 (6.23%) Artificial Intelligence
18 58 (5.31%) Decision-Making
Programming Languages
1 107 (9.80%) C#
2 106 (9.71%) JavaScript
3 100 (9.16%) SQL
4 79 (7.23%) Java
5 72 (6.59%) Python
6 50 (4.58%) TypeScript
7 35 (3.21%) C++
8 23 (2.11%) C
9 10 (0.92%) PowerShell
10 7 (0.64%) Bicep
11 6 (0.55%) Scala
12 5 (0.46%) ABAP
12 5 (0.46%) Apex Code
12 5 (0.46%) Bash
12 5 (0.46%) Data Analysis Expressions
12 5 (0.46%) Haskell
12 5 (0.46%) Shell Script
13 4 (0.37%) Go
13 4 (0.37%) MATLAB
13 4 (0.37%) R
Qualifications
1 132 (12.09%) Degree
2 73 (6.68%) Security Cleared
3 42 (3.85%) SC Cleared
4 29 (2.66%) Computer Science Degree
5 20 (1.83%) CIPD
6 19 (1.74%) Microsoft Certification
7 14 (1.28%) Cisco Certification
8 12 (1.10%) Azure Certification
8 12 (1.10%) Master's Degree
9 11 (1.01%) CCNP
9 11 (1.01%) ITIL Foundation Certificate
9 11 (1.01%) MCSE
10 10 (0.92%) AWS Certification
11 9 (0.82%) DBS Check
12 8 (0.73%) AWS Certified Solutions Architect
13 6 (0.55%) CISM
13 6 (0.55%) CISSP
14 5 (0.46%) CRISC
14 5 (0.46%) DV Cleared
15 4 (0.37%) CREST Certified
Quality Assurance & Compliance
1 35 (3.21%) SLA
2 30 (2.75%) QA
3 18 (1.65%) GDPR
4 16 (1.47%) Data Quality
5 15 (1.37%) Good Clinical Practice
6 13 (1.19%) ISO/IEC 27001
7 8 (0.73%) GRC
7 8 (0.73%) PMO
7 8 (0.73%) Sarbanes-Oxley
8 7 (0.64%) NIST
9 6 (0.55%) PCI DSS
10 5 (0.46%) Cyber Essentials
10 5 (0.46%) Cyber Essentials PLUS
10 5 (0.46%) ISO 14001
10 5 (0.46%) ISO 22301
10 5 (0.46%) ISO 9001
10 5 (0.46%) NEBOSH
11 4 (0.37%) Accessibility
11 4 (0.37%) IFRS
12 3 (0.27%) ITGC
System Software
1 66 (6.04%) Docker
2 59 (5.40%) Active Directory
3 17 (1.56%) Hyper-V
4 11 (1.01%) Virtual Machines
5 10 (0.92%) VMware Infrastructure
6 7 (0.64%) Firmware
7 5 (0.46%) Virtual Desktop
8 2 (0.18%) HDFS
Systems Management
1 69 (6.32%) Kubernetes
2 16 (1.47%) Terraform
3 15 (1.37%) Puppet
4 14 (1.28%) Microsoft Intune
5 13 (1.19%) ZABBIX
6 12 (1.10%) Ansible
7 8 (0.73%) SCCM
8 7 (0.64%) MIIS
9 3 (0.27%) Nessus
10 2 (0.18%) Autotask
10 2 (0.18%) Consul
10 2 (0.18%) WSUS
11 1 (0.092%) EMC VPLEX
11 1 (0.092%) Nagios
11 1 (0.092%) NetBackup
11 1 (0.092%) Netcool
11 1 (0.092%) Nmap
11 1 (0.092%) Progress Chef
11 1 (0.092%) Salt
11 1 (0.092%) SCOM
Vendors
1 138 (12.64%) Microsoft
2 42 (3.85%) Cisco
3 41 (3.75%) SAP
4 32 (2.93%) Oracle
5 20 (1.83%) Salesforce
5 20 (1.83%) VMware
6 14 (1.28%) Google
7 12 (1.10%) Palo Alto
7 12 (1.10%) ServiceNow
8 8 (0.73%) Apple
8 8 (0.73%) OpenText
9 7 (0.64%) RedGate
10 6 (0.55%) Citrix
10 6 (0.55%) MuleSoft
11 5 (0.46%) Alteryx
12 4 (0.37%) Apttus
12 4 (0.37%) Barracuda Networks
12 4 (0.37%) Databricks
12 4 (0.37%) ForgeRock
12 4 (0.37%) Sitecore