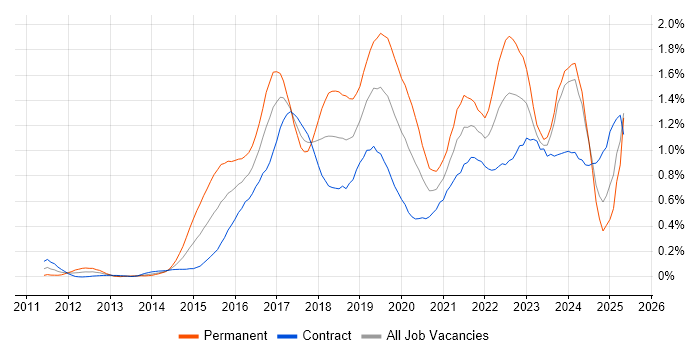
Splunk Job Trends in Scotland

Splunk
UK > Scotland

The table below provides summary statistics for permanent job vacancies advertised in Scotland requiring knowledge or experience of Splunk products and/or services. It includes a benchmarking guide to the annual salaries offered in vacancies that cited Splunk over the 6 months leading up to 24 October 2025, comparing them to the same period in the previous two years.

The figures below represent the IT labour market in general and are not representative of salaries within Splunk, Inc.

6 months to
24 Oct 2025
Same period 2024 Same period 2023
Rank 102 130 122
Rank change year-on-year +28 -8 +26
Permanent jobs citing Splunk 48 28 31
As % of all permanent jobs in Scotland 1.79% 0.84% 1.26%
As % of the Vendors category 3.79% 3.10% 3.02%
Number of salaries quoted 4 16 29
10th Percentile - £41,250 £35,000
25th Percentile £51,250 £46,713 £42,874
Median annual salary (50th Percentile) £63,500 £68,250 £70,576
Median % change year-on-year -6.96% -3.30% +15.36%
75th Percentile £78,938 £80,000 £80,000
90th Percentile £81,075 - £90,387
UK median annual salary £70,000 £70,000 £70,000
% change year-on-year - - -3.45%

All Vendors
Scotland

Splunk falls under the Vendor Products and Services category. For comparison with the information above, the following table provides summary statistics for all permanent job vacancies requiring knowledge or experience of all vendor products and services in Scotland.

Permanent vacancies with a requirement for knowledge or experience of vendor products and services 1,266 903 1,028
As % of all permanent jobs advertised in Scotland 47.33% 27.17% 41.91%
Number of salaries quoted 522 413 881
10th Percentile £25,087 £31,250 -
25th Percentile £28,625 £38,750 £25,000
Median annual salary (50th Percentile) £32,851 £50,000 £40,356
Median % change year-on-year -34.30% +23.90% -23.13%
75th Percentile £48,750 £65,000 £62,833
90th Percentile £71,125 £80,000 £80,000
UK median annual salary £50,000 £57,500 £56,000
% change year-on-year -13.04% +2.68% -0.85%

Splunk
Job Vacancy Trend in Scotland

Historical trend showing the proportion of permanent IT job postings citing Splunk relative to all permanent IT jobs advertised in Scotland.

Splunk job vacancy trend in Scotland

Splunk
Salary Trend in Scotland

Salary distribution trend for jobs in Scotland citing Splunk.

Salary distribution trend for jobs in Scotland citing Splunk

Splunk
Salary Histogram in Scotland

Salary distribution for jobs citing Splunk in Scotland over the 6 months to 24 October 2025.

Salary histogram for Splunk in Scotland

Splunk
Job Locations in Scotland

The table below looks at the demand and provides a guide to the median salaries quoted in IT jobs citing Splunk within the Scotland region over the 6 months to 24 October 2025. The 'Rank Change' column provides an indication of the change in demand within each location based on the same 6 month period last year.

Location Rank Change
on Same Period
Last Year
Matching
Permanent
IT Job Ads
Median Salary
Past 6 Months
Median Salary
% Change
on Same Period
Last Year
Live
Jobs
Glasgow +18 23 £52,500 +23.53%
Edinburgh -1 11 £77,250 +10.36% 3
Stirling - 4 - -
West Lothian - 3 - -
Lanarkshire - 2 - -
Dunbartonshire - 2 £52,500 -
Fife - 1 - -
Midlothian - 1 - - 3
North Lanarkshire - 1 - -
Splunk
UK

Splunk
Co-Occurring Skills & Capabilities in Scotland by Category

The following tables expand on the one above by listing co-occurrences grouped by category. They cover the same employment type, locality and period, with up to 20 co-occurrences shown in each category:

Application Platforms
1 8 (16.67%) Camunda
1 8 (16.67%) Oracle Workflow
2 3 (6.25%) CICS
2 3 (6.25%) WebSphere
3 2 (4.17%) SharePoint
4 1 (2.08%) Apache Airflow
Cloud Services
1 15 (31.25%) AWS
2 7 (14.58%) Azure
3 4 (8.33%) Azure AKS
3 4 (8.33%) Azure Monitor
4 3 (6.25%) GCP
5 2 (4.17%) Amazon CloudWatch
6 1 (2.08%) BlazeMeter
6 1 (2.08%) Datadog
Communications & Networking
1 15 (31.25%) Broadband
2 2 (4.17%) Firewall
2 2 (4.17%) LAN
2 2 (4.17%) WAN
3 1 (2.08%) BGP
3 1 (2.08%) MPLS
3 1 (2.08%) Software-Defined Networking
3 1 (2.08%) Wireless
3 1 (2.08%) Wireshark
Database & Business Intelligence
1 4 (8.33%) Elasticsearch
2 3 (6.25%) DB2
3 2 (4.17%) Apache Cassandra
3 2 (4.17%) MongoDB
4 1 (2.08%) CockroachDB
4 1 (2.08%) Couchbase
4 1 (2.08%) DynamoDB
4 1 (2.08%) MySQL
4 1 (2.08%) NoSQL
4 1 (2.08%) PostgreSQL
4 1 (2.08%) Redis
Development Applications
1 19 (39.58%) Jenkins
2 15 (31.25%) GitLab
2 15 (31.25%) SonarQube
3 10 (20.83%) JIRA
4 9 (18.75%) JUnit
5 4 (8.33%) Git
General
1 37 (77.08%) Inclusion and Diversity
2 32 (66.67%) Marketing
3 25 (52.08%) Finance
4 22 (45.83%) Law
5 15 (31.25%) Games
6 9 (18.75%) Analytical Skills
7 5 (10.42%) Social Skills
8 4 (8.33%) Banking
9 2 (4.17%) Military
10 1 (2.08%) Legal
Job Titles
1 18 (37.50%) Software Engineer
2 15 (31.25%) Architect
3 14 (29.17%) Salesforce Architect
4 9 (18.75%) Java Engineer
4 9 (18.75%) Java Software Engineer
5 8 (16.67%) Salesforce Technical Architect
5 8 (16.67%) Site Reliability Engineer
5 8 (16.67%) Technical Architect
6 7 (14.58%) Infrastructure Engineer
7 6 (12.50%) Lead
8 5 (10.42%) Full-Stack Engineer
8 5 (10.42%) Full-Stack Software Engineer
9 4 (8.33%) Azure Engineer
9 4 (8.33%) Lead Java Engineer
9 4 (8.33%) Lead Software Engineer
9 4 (8.33%) Salesforce Solution Architect
9 4 (8.33%) Site Engineer
9 4 (8.33%) Software Support Engineer
9 4 (8.33%) Solutions Architect
9 4 (8.33%) Support Engineer
Libraries, Frameworks & Software Standards
1 27 (56.25%) REST
2 15 (31.25%) Lightning Web Components
2 15 (31.25%) SOAP
2 15 (31.25%) Visualforce
3 9 (18.75%) Spring
4 8 (16.67%) JDBC
4 8 (16.67%) OpenAPI
4 8 (16.67%) Spring Boot
4 8 (16.67%) Swagger
4 8 (16.67%) WSDL
5 4 (8.33%) .NET
5 4 (8.33%) RESTful
6 2 (4.17%) Kafka
7 1 (2.08%) CSS
7 1 (2.08%) Memcached
7 1 (2.08%) React
Miscellaneous
1 20 (41.67%) Product Ownership
2 10 (20.83%) Algorithms
3 6 (12.50%) Public Cloud
4 4 (8.33%) Cloud Native
5 3 (6.25%) Mainframe
6 2 (4.17%) Clustering
6 2 (4.17%) Data Protection Act
6 2 (4.17%) Legacy Systems
6 2 (4.17%) Private Cloud
7 1 (2.08%) Cyber Kill Chain
7 1 (2.08%) Data Centre
7 1 (2.08%) Enterprise Software
7 1 (2.08%) Security Posture
Operating Systems
1 8 (16.67%) Windows
2 6 (12.50%) Linux
3 4 (8.33%) Red Hat Enterprise Linux
3 4 (8.33%) Ubuntu
4 2 (4.17%) Windows 10
4 2 (4.17%) Windows Server
5 1 (2.08%) Mac OS
Processes & Methodologies
1 40 (83.33%) Agile
2 38 (79.17%) CI/CD
3 29 (60.42%) Community of Practice
4 22 (45.83%) Roadmaps
4 22 (45.83%) Software Engineering
5 21 (43.75%) Continuous Improvement
6 20 (41.67%) DevOps
6 20 (41.67%) Scrum
6 20 (41.67%) SDLC
7 19 (39.58%) Continuous Delivery
7 19 (39.58%) Continuous Integration
8 17 (35.42%) AI
8 17 (35.42%) Machine Learning
8 17 (35.42%) Operational Stability
9 16 (33.33%) Design Patterns
9 16 (33.33%) Observability
10 15 (31.25%) Event-Driven
10 15 (31.25%) Static Code Analysis
10 15 (31.25%) Technical Analysis
10 15 (31.25%) Technology Roadmap
Programming Languages
1 22 (45.83%) Java
2 15 (31.25%) Apex Code
2 15 (31.25%) Python
2 15 (31.25%) SOQL
2 15 (31.25%) SOSL
3 8 (16.67%) PowerShell
4 5 (10.42%) SQL
5 1 (2.08%) C
5 1 (2.08%) C#
5 1 (2.08%) C++
5 1 (2.08%) JavaScript
5 1 (2.08%) TypeScript
Qualifications
1 4 (8.33%) Azure Certification
2 2 (4.17%) DV Cleared
2 2 (4.17%) Security Cleared
3 1 (2.08%) CEH
3 1 (2.08%) CISSP
3 1 (2.08%) GCIA
3 1 (2.08%) GIAC
3 1 (2.08%) GREM
3 1 (2.08%) OSCP
3 1 (2.08%) SSCP
Quality Assurance & Compliance
1 1 (2.08%) ISO/IEC 27001
1 1 (2.08%) NIST
System Software
1 4 (8.33%) Docker
2 3 (6.25%) RACF
3 2 (4.17%) Active Directory
3 2 (4.17%) VMware Infrastructure
3 2 (4.17%) vSphere
Systems Management
1 19 (39.58%) Grafana
2 16 (33.33%) Kubernetes
3 15 (31.25%) Terraform
4 6 (12.50%) Prometheus
5 4 (8.33%) ITRS Geneos
5 4 (8.33%) Netcool
5 4 (8.33%) Netcool/OMNIbus
5 4 (8.33%) Tivoli
6 3 (6.25%) Ansible
7 1 (2.08%) Computer Incident Response Team
7 1 (2.08%) QRadar
Vendors
1 17 (35.42%) Dynatrace
2 15 (31.25%) Salesforce
3 13 (27.08%) Oracle
4 11 (22.92%) ServiceNow
5 7 (14.58%) IBM
6 4 (8.33%) Red Hat
7 3 (6.25%) Broadcom
8 2 (4.17%) Cisco
8 2 (4.17%) CrowdStrike
8 2 (4.17%) Juniper
8 2 (4.17%) McAfee
8 2 (4.17%) Microsoft
8 2 (4.17%) NetApp
8 2 (4.17%) SolarWinds
8 2 (4.17%) VMware
9 1 (2.08%) F5
9 1 (2.08%) Fortinet
9 1 (2.08%) Google
9 1 (2.08%) Qualys
9 1 (2.08%) Sybase