Analytical Skills Job Trends in Scotland

Analytical Skills
UK > Scotland

The table below looks at the prevalence of the term Analytical Skills in permanent job vacancies in Scotland. Included is a benchmarking guide to the salaries offered in vacancies that cited Analytical Skills over the 6 months leading up to 26 October 2025, comparing them to the same period in the previous two years.

6 months to
26 Oct 2025
Same period 2024 Same period 2023
Rank 14 15 30
Rank change year-on-year +1 +15 -5
Permanent jobs citing Analytical Skills 350 305 191
As % of all permanent jobs in Scotland 13.06% 9.32% 7.82%
As % of the General category 18.49% 15.82% 10.54%
Number of salaries quoted 92 118 152
10th Percentile £26,250 £27,500 £37,525
25th Percentile £31,750 £38,750 £43,750
Median annual salary (50th Percentile) £33,500 £51,093 £57,500
Median % change year-on-year -34.43% -11.14% +21.05%
75th Percentile £49,125 £68,750 £65,000
90th Percentile £71,575 £95,000 £73,000
UK median annual salary £50,000 £55,000 £55,000
% change year-on-year -9.09% - -

All General Skills
Scotland

Analytical Skills falls under the General Skills category. For comparison with the information above, the following table provides summary statistics for all permanent job vacancies requiring common skills in Scotland.

Permanent vacancies with a requirement for common skills 1,893 1,928 1,813
As % of all permanent jobs advertised in Scotland 70.63% 58.89% 74.27%
Number of salaries quoted 753 872 1,496
10th Percentile £25,684 £31,250 £25,000
25th Percentile £31,250 £38,750 £32,886
Median annual salary (50th Percentile) £33,000 £51,750 £52,500
Median % change year-on-year -36.23% -1.43% -4.55%
75th Percentile £54,500 £67,563 £68,750
90th Percentile £73,750 £85,000 £82,548
UK median annual salary £51,941 £60,000 £60,000
% change year-on-year -13.43% - -

Analytical Skills
Job Vacancy Trend in Scotland

Historical trend showing the proportion of permanent IT job postings citing Analytical Skills relative to all permanent IT jobs advertised in Scotland.
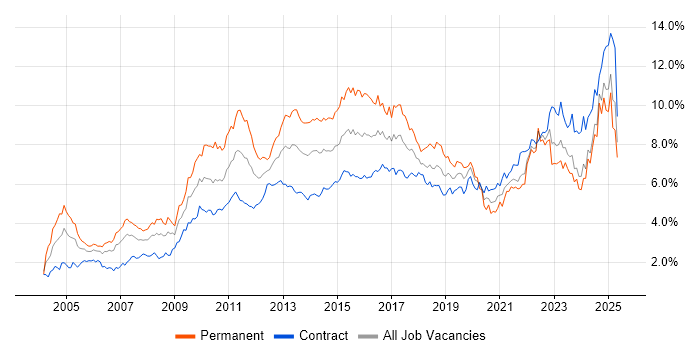
Analytical Skills job vacancy trend in Scotland

Analytical Skills
Salary Trend in Scotland

Salary distribution trend for jobs in Scotland citing Analytical Skills.

Salary distribution trend for jobs in Scotland citing Analytical Skills

Analytical Skills
Salary Histogram in Scotland

Salary distribution for jobs citing Analytical Skills in Scotland over the 6 months to 26 October 2025.

Salary histogram for Analytical Skills in Scotland

Analytical Skills
Job Locations in Scotland

The table below looks at the demand and provides a guide to the median salaries quoted in IT jobs citing Analytical Skills within the Scotland region over the 6 months to 26 October 2025. The 'Rank Change' column provides an indication of the change in demand within each location based on the same 6 month period last year.

Location Rank Change
on Same Period
Last Year
Matching
Permanent
IT Job Ads
Median Salary
Past 6 Months
Median Salary
% Change
on Same Period
Last Year
Live
Jobs
Edinburgh -1 116 £40,000 -40.74% 43
Glasgow -2 95 £45,000 -16.03% 42
North Lanarkshire - 23 £31,750 - 2
Renfrewshire +2 18 £31,750 -20.63% 8
Stirling +8 16 £31,750 -22.09% 2
Dundee +7 10 £33,500 -18.25% 6
South Lanarkshire 0 10 - - 4
Lanarkshire -1 10 £27,500 - 16
Aberdeen -1 7 £26,150 -47.70% 7
Perth and Kinross - 7 £33,500 - 2
West Dunbartonshire - 6 £60,000 -
Falkirk +1 5 - - 2
Ayrshire - 5 - - 1
North Ayrshire - 5 - -
East Ayrshire - 5 - - 2
Midlothian - 5 - - 27
Inverclyde - 3 £31,750 - 1
Fife 0 2 £50,000 +17.65% 8
Highlands -9 2 £52,500 +72.13% 5
Analytical Skills
UK

Analytical Skills
Co-Occurring Skills & Capabilities in Scotland by Category

The following tables expand on the one above by listing co-occurrences grouped by category. They cover the same employment type, locality and period, with up to 20 co-occurrences shown in each category:

Application Platforms
1 13 (3.71%) Confluence
2 8 (2.29%) Camunda
2 8 (2.29%) Oracle Workflow
3 5 (1.43%) Apache Spark
4 2 (0.57%) SAS
4 2 (0.57%) SharePoint
5 1 (0.29%) CMS
Applications
1 41 (11.71%) Chatbot
2 24 (6.86%) Microsoft Excel
3 6 (1.71%) Microsoft Office
4 5 (1.43%) AutoCAD
4 5 (1.43%) SOLIDWORKS
5 4 (1.14%) Microsoft PowerPoint
5 4 (1.14%) Oracle Smart View
6 1 (0.29%) Microsoft Project
6 1 (0.29%) MS Visio
Business Applications
1 10 (2.86%) Oracle Payables
1 10 (2.86%) Oracle Receivables
2 9 (2.57%) Workday HCM
3 8 (2.29%) Oracle Assets
3 8 (2.29%) Oracle ERP
3 8 (2.29%) Oracle Financials
3 8 (2.29%) Oracle General Ledger
4 4 (1.14%) Hyperion Planning
4 4 (1.14%) SAP CO
4 4 (1.14%) SAP FI
4 4 (1.14%) SAP FI/CO
4 4 (1.14%) SAP S/4HANA
5 1 (0.29%) Dynamics CRM
Cloud Services
1 37 (10.57%) Azure
2 27 (7.71%) AWS
3 26 (7.43%) Azure DevOps
3 26 (7.43%) Snowflake
4 22 (6.29%) Power Platform
5 11 (3.14%) GitHub
5 11 (3.14%) GitHub Copilot
6 9 (2.57%) dbt
6 9 (2.57%) SuccessFactors
7 5 (1.43%) Amazon S3
7 5 (1.43%) AWS Lambda
7 5 (1.43%) Serverless
8 4 (1.14%) Amazon EC2
8 4 (1.14%) Amazon ECS
8 4 (1.14%) Amazon EMR
8 4 (1.14%) Amazon MSK
8 4 (1.14%) OCI
8 4 (1.14%) Power Automate
9 3 (0.86%) Azure Data Factory
9 3 (0.86%) GCP
Communications & Networking
1 17 (4.86%) LAN
1 17 (4.86%) VoIP
1 17 (4.86%) Wi-Fi
2 4 (1.14%) SAN
3 2 (0.57%) Bluetooth
3 2 (0.57%) Ethernet
3 2 (0.57%) LoRaWAN
3 2 (0.57%) Modbus
3 2 (0.57%) MQTT
4 1 (0.29%) Intranet
4 1 (0.29%) Wireshark
Database & Business Intelligence
1 25 (7.14%) Tableau
2 21 (6.00%) Power BI
3 18 (5.14%) Data Warehouse
4 9 (2.57%) Snowflake Schema
5 7 (2.00%) Data Mining
6 5 (1.43%) Apache Hive
6 5 (1.43%) Big Data
6 5 (1.43%) Hadoop
6 5 (1.43%) HBase
7 4 (1.14%) Amazon Athena
7 4 (1.14%) Amazon RDS
7 4 (1.14%) Electronic Patient Records
7 4 (1.14%) Essbase
7 4 (1.14%) Oracle BI Publisher
7 4 (1.14%) SAP BW
8 3 (0.86%) Metadata
9 1 (0.29%) Azure SQL Database
9 1 (0.29%) DynamoDB
9 1 (0.29%) Neo4j
9 1 (0.29%) Power Query
Development Applications
1 24 (6.86%) JIRA
2 17 (4.86%) Oracle Forms
3 13 (3.71%) Maven
4 11 (3.14%) Git
5 8 (2.29%) ER Studio
5 8 (2.29%) ERwin
5 8 (2.29%) Jenkins
5 8 (2.29%) JUnit
6 5 (1.43%) Gradle
7 4 (1.14%) Subversion
General
1 198 (56.57%) Social Skills
2 121 (34.57%) Finance
3 35 (10.00%) Marketing
4 27 (7.71%) Law
5 24 (6.86%) Inclusion and Diversity
6 21 (6.00%) Banking
7 18 (5.14%) Legal
8 15 (4.29%) Organisational Skills
9 7 (2.00%) Public Sector
9 7 (2.00%) Retail
10 6 (1.71%) Advertising
10 6 (1.71%) Front Office
11 5 (1.43%) Presentation Skills
12 4 (1.14%) Influencing Skills
13 3 (0.86%) Electronics
13 3 (0.86%) General Ledger
14 2 (0.57%) Billing
14 2 (0.57%) Private Banking
14 2 (0.57%) Telecoms
14 2 (0.57%) Wholesale Banking
Job Titles
1 80 (22.86%) Innovation Manager
2 61 (17.43%) Analyst
3 41 (11.71%) Trainer
4 29 (8.29%) Senior
5 28 (8.00%) Trainee
6 24 (6.86%) IT Support
6 24 (6.86%) Software Engineer
7 21 (6.00%) Graduate
8 17 (4.86%) IT Assistant
8 17 (4.86%) IT Support Assistant
8 17 (4.86%) Java Engineer
8 17 (4.86%) Java Software Engineer
8 17 (4.86%) Support Assistant
9 14 (4.00%) Developer
10 13 (3.71%) Business Analyst
11 12 (3.43%) Data Analyst
12 10 (2.86%) Data Modeller
13 9 (2.57%) Java Developer
13 9 (2.57%) Java Software Developer
13 9 (2.57%) Software Developer
Libraries, Frameworks & Software Standards
1 21 (6.00%) Spring
2 14 (4.00%) REST
3 12 (3.43%) Spring Boot
4 8 (2.29%) JDBC
4 8 (2.29%) OpenAPI
4 8 (2.29%) Swagger
4 8 (2.29%) WSDL
5 5 (1.43%) JPA
5 5 (1.43%) React
6 4 (1.14%) AngularJS
6 4 (1.14%) Hibernate
6 4 (1.14%) HTML
6 4 (1.14%) jQuery
6 4 (1.14%) Kafka
7 1 (0.29%) AWS CDK
7 1 (0.29%) Middleware
7 1 (0.29%) PySpark
Miscellaneous
1 25 (7.14%) Product Ownership
2 23 (6.57%) Analytical Mindset
3 21 (6.00%) Self-Motivation
4 13 (3.71%) Management Information System
5 10 (2.86%) Algorithms
6 9 (2.57%) Cloud Native
7 8 (2.29%) Onboarding
8 6 (1.71%) Driving Licence
9 5 (1.43%) Legacy Systems
10 4 (1.14%) Data Centre
10 4 (1.14%) Digital Media
10 4 (1.14%) Equities
10 4 (1.14%) Smartphone
11 3 (0.86%) Embedded Systems
11 3 (0.86%) Low-Code
12 2 (0.57%) ARM Cortex
12 2 (0.57%) IoT
12 2 (0.57%) Life Science
12 2 (0.57%) Mainframe
12 2 (0.57%) Security Posture
Operating Systems
1 5 (1.43%) Unix
2 1 (0.29%) Android
2 1 (0.29%) Apple iOS
2 1 (0.29%) Linux
2 1 (0.29%) Mac OS
2 1 (0.29%) Windows
2 1 (0.29%) zOS
Processes & Methodologies
1 162 (46.29%) AI
2 141 (40.29%) Problem-Solving
3 139 (39.71%) Continuous Improvement
4 113 (32.29%) Analytics
5 112 (32.00%) Stakeholder Management
6 107 (30.57%) Decision-Making
7 89 (25.43%) Customer Experience
8 87 (24.86%) Agile
9 81 (23.14%) Data-Driven Decision Making
10 55 (15.71%) Asset Management
11 51 (14.57%) Coaching
12 41 (11.71%) Chemistry
12 41 (11.71%) Conversational UI
13 36 (10.29%) Business Intelligence
14 32 (9.14%) CI/CD
14 32 (9.14%) Critical Thinking
14 32 (9.14%) Emotional Intelligence
15 29 (8.29%) DevOps
15 29 (8.29%) Project Management
16 26 (7.43%) Software Engineering
Programming Languages
1 55 (15.71%) SQL
2 41 (11.71%) Python
3 22 (6.29%) Java
4 6 (1.71%) JavaScript
5 5 (1.43%) PL/SQL
6 4 (1.14%) Groovy
7 3 (0.86%) C
7 3 (0.86%) C++
8 2 (0.57%) Bash
8 2 (0.57%) R
9 1 (0.29%) Cypher
9 1 (0.29%) MATLAB
9 1 (0.29%) PowerShell
9 1 (0.29%) Scala
9 1 (0.29%) VBA
Qualifications
1 111 (31.71%) Degree
2 69 (19.71%) Master's Degree
3 47 (13.43%) PhD
4 8 (2.29%) Computer Science Degree
5 5 (1.43%) Microsoft Certification
6 4 (1.14%) A+ Certification
6 4 (1.14%) CCNA
6 4 (1.14%) Cisco Certification
6 4 (1.14%) MCSE
6 4 (1.14%) Network+ Certification
7 3 (0.86%) BPSS Clearance
7 3 (0.86%) CCA
7 3 (0.86%) Security Cleared
8 2 (0.57%) CBAP
8 2 (0.57%) CEH
8 2 (0.57%) SC Cleared
9 1 (0.29%) CSSLP
9 1 (0.29%) GIAC
9 1 (0.29%) GREM
9 1 (0.29%) OSCP
Quality Assurance & Compliance
1 10 (2.86%) Accessibility
2 7 (2.00%) Data Quality
3 5 (1.43%) PMO
4 3 (0.86%) QA
5 2 (0.57%) JTAG
5 2 (0.57%) NIST
5 2 (0.57%) PERC
5 2 (0.57%) Sarbanes-Oxley
6 1 (0.29%) Actionable Recommendations
6 1 (0.29%) GDPR
6 1 (0.29%) GRC
6 1 (0.29%) ISO 20022
6 1 (0.29%) ISO 8583
6 1 (0.29%) ISO/IEC 27001
6 1 (0.29%) NIST 800
6 1 (0.29%) SEPA
6 1 (0.29%) SOC 2
System Software
1 5 (1.43%) HDFS
2 2 (0.57%) Embedded Firmware
2 2 (0.57%) Firmware
3 1 (0.29%) RACF
Systems Management
1 12 (3.43%) Kubernetes
2 8 (2.29%) Terraform
3 1 (0.29%) Computer Incident Response Team
3 1 (0.29%) QRadar
3 1 (0.29%) RSA Archer
Vendors
1 41 (11.71%) PayPal
2 36 (10.29%) Oracle
3 23 (6.57%) Microsoft
4 15 (4.29%) SAP
5 9 (2.57%) Splunk
5 9 (2.57%) Workday
6 8 (2.29%) Dynatrace
7 6 (1.71%) Alteryx
7 6 (1.71%) Databricks
8 5 (1.43%) Cisco
8 5 (1.43%) Cloudera
8 5 (1.43%) Infor
9 4 (1.14%) Dell
9 4 (1.14%) Hyperion
9 4 (1.14%) ServiceNow
10 3 (0.86%) Teradata
11 2 (0.57%) Google
11 2 (0.57%) NVIDIA
12 1 (0.29%) CrowdStrike
12 1 (0.29%) Verint