Azure Jobs in Scotland

Microsoft Azure
UK > Scotland

The table below provides summary statistics for permanent job vacancies advertised in Scotland requiring Azure skills. It includes a benchmarking guide to the annual salaries offered in vacancies that cited Azure over the 6 months leading up to 26 July 2024, comparing them to the same period in the previous two years.

6 months to
26 Jul 2024
Same period 2023 Same period 2022
Rank 25 5 4
Rank change year-on-year -20 -1 0
Permanent jobs citing Azure 631 691 1,145
As % of all permanent jobs advertised in Scotland 11.07% 18.21% 18.80%
As % of the Cloud Services category 28.91% 50.11% 51.48%
Number of salaries quoted 340 338 638
10th Percentile £28,250 £36,850 £35,000
25th Percentile £40,833 £43,563 £44,097
Median annual salary (50th Percentile) £55,000 £55,000 £55,000
Median % change year-on-year - - +4.76%
75th Percentile £69,850 £69,649 £71,250
90th Percentile £80,000 £82,500 £82,500
UK median annual salary £60,000 £62,500 £62,500
% change year-on-year -4.00% - +4.17%

All Cloud Skills
Scotland

Azure falls under the Cloud Services category. For comparison with the information above, the following table provides summary statistics for all permanent job vacancies requiring cloud computing skills in Scotland.

Permanent vacancies with a requirement for cloud computing skills 2,183 1,379 2,224
As % of all permanent jobs advertised in Scotland 38.31% 36.35% 36.52%
Number of salaries quoted 824 827 1,369
10th Percentile £27,825 £30,000 £31,250
25th Percentile £38,208 £40,000 £42,500
Median annual salary (50th Percentile) £52,500 £55,000 £55,000
Median % change year-on-year -4.55% - +10.00%
75th Percentile £69,750 £71,250 £75,000
90th Percentile £80,000 £82,500 £85,000
UK median annual salary £60,000 £62,500 £62,500
% change year-on-year -4.00% - +4.17%

Azure
Job Vacancy Trend in Scotland

Job postings citing Azure as a proportion of all IT jobs advertised in Scotland.
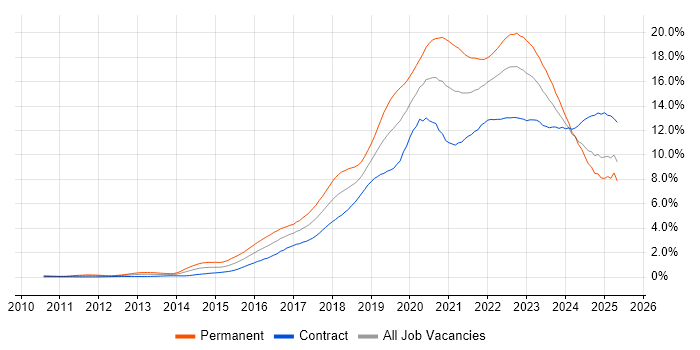
Job vacancy trend for Azure in Scotland

Azure
Salary Trend in Scotland

3-month moving average salary quoted in jobs citing Azure in Scotland.

Salary trend for Azure in Scotland

Azure
Salary Histogram in Scotland

Salary distribution for jobs citing Azure in Scotland over the 6 months to 26 July 2024.

Salary histogram for Azure in Scotland

Azure
Job Locations in Scotland

The table below looks at the demand and provides a guide to the median salaries quoted in IT jobs citing Azure within the Scotland region over the 6 months to 26 July 2024. The 'Rank Change' column provides an indication of the change in demand within each location based on the same 6 month period last year.

Location Rank Change
on Same Period
Last Year
Matching
Permanent
IT Job Ads
Median Salary
Past 6 Months
Median Salary
% Change
on Same Period
Last Year
Live
Jobs
Glasgow -34 326 £55,000 +2.80% 35
Edinburgh -2 223 £61,250 +2.90% 33
Aberdeen +4 23 £42,500 -19.05% 6
Dundee +7 14 £60,000 -0.41% 1
Lanarkshire -2 11 £80,000 +79.78% 17
Fife -7 5 £33,000 +10.00% 1
Stirling -4 3 £46,000 +18.71%
Aberdeenshire -4 3 £28,500 +11.76% 6
West Lothian -6 3 £60,000 - 2
East Ayrshire - 3 £29,500 -
West Dunbartonshire -1 1 £27,500 -
South Ayrshire - 1 £57,500 -
Dumfries and Galloway - 1 £57,500 -
Azure
UK

Azure
Co-occurring Skills and Capabilities in Scotland by Category

The follow tables expand on the table above by listing co-occurrences grouped by category. The same employment type, locality and period is covered with up to 20 co-occurrences shown in each of the following categories:

Application Platforms
1 38 (6.02%) ArcGIS
1 38 (6.02%) GeoServer
2 26 (4.12%) SharePoint
3 24 (3.80%) Microsoft Exchange
4 17 (2.69%) Cloud Foundry
5 10 (1.58%) Umbraco
5 10 (1.58%) WebLogic
6 8 (1.27%) WildFly
7 6 (0.95%) Apache Spark
8 5 (0.79%) Confluence
9 4 (0.63%) Apache
9 4 (0.63%) IIS
10 3 (0.48%) Adobe Experience Manager
11 2 (0.32%) BizTalk Server
11 2 (0.32%) OpenStack
12 1 (0.16%) Apache Solr
12 1 (0.16%) CMS
12 1 (0.16%) SAS
12 1 (0.16%) Sitecore CMS
Applications
1 7 (1.11%) Microsoft Office
2 4 (0.63%) Microsoft Excel
Business Applications
1 8 (1.27%) Sparx Enterprise Architect
2 4 (0.63%) Dynamics CRM
3 2 (0.32%) Oracle EBS
Cloud Services
1 325 (51.51%) AWS
2 149 (23.61%) GCP
3 122 (19.33%) Microsoft 365
4 76 (12.04%) Entra ID
5 51 (8.08%) SaaS
6 44 (6.97%) Power Platform
7 41 (6.50%) Azure DevOps
8 31 (4.91%) Cloud Computing
9 27 (4.28%) IaaS
9 27 (4.28%) PaaS
10 15 (2.38%) Amazon ECS
10 15 (2.38%) Datadog
11 11 (1.74%) Azure Data Factory
11 11 (1.74%) Dynamics 365
12 10 (1.58%) GitHub
13 9 (1.43%) OneDrive
14 8 (1.27%) Amazon EKS
14 8 (1.27%) Azure Logic Apps
14 8 (1.27%) Azure Sentinel
14 8 (1.27%) OpenShift
Communications & Networking
1 39 (6.18%) Firewall
2 29 (4.60%) WAN
3 19 (3.01%) Kerberos
4 18 (2.85%) TCP/IP
4 18 (2.85%) VPN
5 16 (2.54%) DNS
6 15 (2.38%) SD-WAN
7 12 (1.90%) VoIP
8 11 (1.74%) BGP
9 10 (1.58%) LAN
10 9 (1.43%) VLAN
11 8 (1.27%) SSL
12 7 (1.11%) Broadband
12 7 (1.11%) DHCP
12 7 (1.11%) Remote Desktop
12 7 (1.11%) Wireless
13 6 (0.95%) SAN
13 6 (0.95%) Wi-Fi
14 5 (0.79%) Internet
15 3 (0.48%) Cisco IOS
Database & Business Intelligence
1 76 (12.04%) SQL Server
2 50 (7.92%) Data Lake
2 50 (7.92%) PostgreSQL
3 39 (6.18%) Data Warehouse
3 39 (6.18%) GIS
4 38 (6.02%) QGIS
5 35 (5.55%) Qlik Sense
6 34 (5.39%) Power BI
7 30 (4.75%) Relational Database
8 23 (3.65%) Azure SQL Database
9 17 (2.69%) Amazon Aurora
9 17 (2.69%) CockroachDB
10 15 (2.38%) Geospatial Data
11 14 (2.22%) NoSQL
12 12 (1.90%) Big Data
12 12 (1.90%) Oracle Database
13 11 (1.74%) Amazon RDS
14 10 (1.58%) RDBMS
14 10 (1.58%) SQL Server Integration Services
15 9 (1.43%) Tableau
Development Applications
1 25 (3.96%) Jenkins
2 21 (3.33%) Git
3 17 (2.69%) JIRA
4 15 (2.38%) GitLab
5 9 (1.43%) Selenium
6 7 (1.11%) Cucumber
7 6 (0.95%) Visual Studio
8 4 (0.63%) Artifactory
8 4 (0.63%) Snyk
9 3 (0.48%) CircleCI
9 3 (0.48%) GoCD
10 2 (0.32%) Cypress.io
10 2 (0.32%) Gradle
10 2 (0.32%) Maven
10 2 (0.32%) SonarQube
10 2 (0.32%) Terragrunt
10 2 (0.32%) webpack
11 1 (0.16%) Oracle APEX
11 1 (0.16%) Oracle Forms
11 1 (0.16%) Team Foundation Server
General
1 175 (27.73%) Finance
2 143 (22.66%) Inclusion and Diversity
3 108 (17.12%) Social Skills
4 103 (16.32%) Law
5 47 (7.45%) Marketing
6 45 (7.13%) Legal
7 36 (5.71%) Analytical Skills
8 34 (5.39%) Presentation Skills
9 31 (4.91%) Banking
10 23 (3.65%) Games
11 15 (2.38%) Public Sector
12 13 (2.06%) Investment Banking
12 13 (2.06%) Retail Banking
13 11 (1.74%) Billing
14 6 (0.95%) Retail
14 6 (0.95%) Telecoms
15 4 (0.63%) Organisational Skills
15 4 (0.63%) Police
16 3 (0.48%) Documentation Skills
16 3 (0.48%) Influencing Skills
Job Titles
1 146 (23.14%) Senior
2 137 (21.71%) Software Engineer
3 121 (19.18%) Lead
4 102 (16.16%) Developer
5 90 (14.26%) Architect
6 62 (9.83%) Senior Software Engineer
7 55 (8.72%) Data Engineer
8 44 (6.97%) .NET Developer
9 37 (5.86%) Lead Software Engineer
10 36 (5.71%) Cloud Engineer
11 31 (4.91%) Infrastructure Engineer
12 27 (4.28%) Cloud Architect
12 27 (4.28%) Software Developer
13 24 (3.80%) Java Engineer
13 24 (3.80%) Solutions Architect
14 22 (3.49%) Analyst
14 22 (3.49%) Lead Architect
14 22 (3.49%) Senior Developer
15 21 (3.33%) Java Software Engineer
16 19 (3.01%) Senior Java Software Engineer
Libraries, Frameworks & Software Standards
1 157 (24.88%) .NET
2 68 (10.78%) .NET Core
3 59 (9.35%) React
4 55 (8.72%) CSS
5 47 (7.45%) Spring
6 43 (6.81%) AngularJS
7 40 (6.34%) .NET Framework
8 38 (6.02%) Leaflet
8 38 (6.02%) OpenLayers
8 38 (6.02%) PostGIS
9 37 (5.86%) Spring Boot
10 36 (5.71%) PySpark
11 31 (4.91%) ASP.NET Web API
12 30 (4.75%) REST
13 29 (4.60%) Entity Framework
14 25 (3.96%) Kafka
15 24 (3.80%) ASP.NET
15 24 (3.80%) OAuth
16 19 (3.01%) GraphQL
16 19 (3.01%) Vue
Miscellaneous
1 95 (15.06%) Public Cloud
2 56 (8.87%) Algorithms
3 47 (7.45%) Cloud Native
4 40 (6.34%) Onboarding
5 20 (3.17%) Data Structures
6 19 (3.01%) Data Centre
7 16 (2.54%) Social Media
8 15 (2.38%) Greenfield Project
8 15 (2.38%) Legacy Systems
9 14 (2.22%) Management Information System
9 14 (2.22%) PKI
9 14 (2.22%) Replication
10 12 (1.90%) Mobile App
10 12 (1.90%) Product Ownership
11 9 (1.43%) Enterprise Software
11 9 (1.43%) Hybrid Cloud
11 9 (1.43%) Self-Motivation
12 8 (1.27%) Private Cloud
13 5 (0.79%) Distributed Systems
13 5 (0.79%) Renewable Energy
Operating Systems
1 86 (13.63%) Windows
2 61 (9.67%) Linux
3 47 (7.45%) Windows Server
4 20 (3.17%) Unix
5 12 (1.90%) Red Hat Enterprise Linux
5 12 (1.90%) Windows 10
6 6 (0.95%) VMS
7 5 (0.79%) Android
7 5 (0.79%) Windows Server 2012
8 4 (0.63%) Ubuntu
8 4 (0.63%) Windows Server 2016
9 2 (0.32%) Apple iOS
9 2 (0.32%) Mac OS X
9 2 (0.32%) Mesosphere
10 1 (0.16%) MVS
Processes & Methodologies
1 233 (36.93%) Agile
2 184 (29.16%) Software Engineering
3 170 (26.94%) DevOps
4 121 (19.18%) CI/CD
5 111 (17.59%) Problem-Solving
6 110 (17.43%) SDLC
7 77 (12.20%) Operational Stability
8 76 (12.04%) Artificial Intelligence
9 74 (11.73%) Mentoring
10 69 (10.94%) Actionable Insight
10 69 (10.94%) Machine Learning
11 56 (8.87%) Decision-Making
12 55 (8.72%) Migration
13 54 (8.56%) Community of Practice
14 53 (8.40%) Continuous Improvement
14 53 (8.40%) Full Stack Development
14 53 (8.40%) OO
15 49 (7.77%) Web Development
16 47 (7.45%) Cybersecurity
17 45 (7.13%) Computer Science
Programming Languages
1 145 (22.98%) Python
2 144 (22.82%) C#
3 113 (17.91%) Java
4 103 (16.32%) SQL
5 82 (13.00%) JavaScript
6 34 (5.39%) PowerShell
7 19 (3.01%) TypeScript
8 18 (2.85%) Bash
9 11 (1.74%) T-SQL
10 9 (1.43%) Kusto Query Language
11 7 (1.11%) Perl
12 6 (0.95%) Groovy
13 5 (0.79%) Bicep
13 5 (0.79%) C++
13 5 (0.79%) PHP
13 5 (0.79%) R
13 5 (0.79%) Scala
14 4 (0.63%) Shell Script
15 3 (0.48%) C
15 3 (0.48%) Ruby
Qualifications
1 61 (9.67%) Security Cleared
2 55 (8.72%) SC Cleared
3 30 (4.75%) Degree
4 29 (4.60%) Azure Certification
5 28 (4.44%) Microsoft Certification
6 23 (3.65%) AWS Certification
7 21 (3.33%) Cisco Certification
8 20 (3.17%) CCNA
9 15 (2.38%) CISSP
10 14 (2.22%) CISM
10 14 (2.22%) Computer Science Degree
11 10 (1.58%) AWS Certified Solutions Architect
12 6 (0.95%) AWS Certified Cloud Practitioner
12 6 (0.95%) HND
12 6 (0.95%) SSCP
12 6 (0.95%) TOGAF Certification
13 5 (0.79%) CompTIA Security+
13 5 (0.79%) Master's Degree
14 4 (0.63%) DBS Check
14 4 (0.63%) PMI Certification
Quality Assurance & Compliance
1 25 (3.96%) QA
2 13 (2.06%) GDPR
2 13 (2.06%) ISO/IEC 27001
3 12 (1.90%) NIST
4 9 (1.43%) Data Quality
5 7 (1.11%) ISO 22301
6 4 (0.63%) Cyber Essentials
6 4 (0.63%) SLA
7 3 (0.48%) Disclosure Scotland
8 2 (0.32%) Accessibility
9 1 (0.16%) IEC 62304
9 1 (0.16%) NCSC
9 1 (0.16%) SOC 2
System Software
1 90 (14.26%) Active Directory
2 53 (8.40%) Docker
3 45 (7.13%) VMware Infrastructure
4 24 (3.80%) Hyper-V
5 17 (2.69%) Virtual Machines
6 15 (2.38%) VMware NSX
7 9 (1.43%) Virtual Desktop
8 6 (0.95%) vSphere
9 5 (0.79%) VMware ESXi
10 2 (0.32%) KVM
10 2 (0.32%) Xen
10 2 (0.32%) XenDesktop
Systems Management
1 83 (13.15%) Kubernetes
2 73 (11.57%) Terraform
3 39 (6.18%) Microsoft Intune
4 38 (6.02%) Ansible
5 15 (2.38%) Grafana
5 15 (2.38%) Prometheus
6 12 (1.90%) FortiGate
7 8 (1.27%) Progress Chef
8 7 (1.11%) Istio
9 6 (0.95%) Puppet
10 4 (0.63%) SCCM
11 3 (0.48%) Fortio
11 3 (0.48%) Kiali
12 2 (0.32%) Docker Swarm
12 2 (0.32%) Single Sign-On
12 2 (0.32%) vCenter Server
13 1 (0.16%) Galera Cluster
13 1 (0.16%) HAProxy
13 1 (0.16%) Nessus
13 1 (0.16%) ZABBIX
Vendors
1 197 (31.22%) Microsoft
2 73 (11.57%) Google
3 60 (9.51%) VMware
4 38 (6.02%) ESRI
5 35 (5.55%) Alteryx
6 31 (4.91%) Cisco
7 17 (2.69%) Splunk
8 16 (2.54%) Dynatrace
8 16 (2.54%) Oracle
9 13 (2.06%) NetApp
9 13 (2.06%) ServiceNow
10 11 (1.74%) Databricks
11 8 (1.27%) Meraki
11 8 (1.27%) Sparx
11 8 (1.27%) Xamarin
12 6 (0.95%) Citrix
12 6 (0.95%) Veeam
13 5 (0.79%) Adobe
13 5 (0.79%) ConnectWise
14 4 (0.63%) Sybase