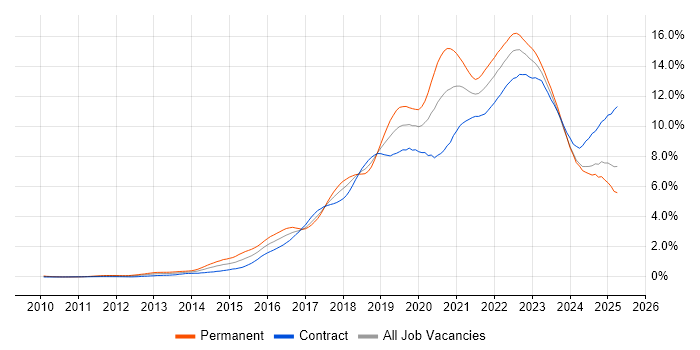
DevOps Job Trends in Scotland

DevOps
UK > Scotland

The table below provides summary statistics and salary benchmarking for jobs advertised in Scotland requiring DevOps skills. It covers vacancies from the 6 months leading up to 13 September 2025, with comparisons to the same periods in the previous two years.

6 months to
13 Sep 2025
Same period 2024 Same period 2023
Rank 27 48 16
Rank change year-on-year +21 -32 -7
Permanent jobs citing DevOps 209 275 292
As % of all permanent jobs advertised in Scotland 8.23% 6.04% 10.70%
As % of the Processes & Methodologies category 9.15% 7.02% 11.17%
Number of salaries quoted 49 126 235
10th Percentile £46,200 £47,500 £43,181
25th Percentile £53,750 £52,500 £47,795
Median annual salary (50th Percentile) £67,500 £65,000 £65,000
Median % change year-on-year +3.85% - +8.33%
75th Percentile £82,500 £80,000 £80,000
90th Percentile £85,700 £90,000 £96,539
UK median annual salary £70,000 £67,500 £70,000
% change year-on-year +3.70% -3.57% -

All Process and Methodology Skills
Scotland

DevOps falls under the Processes and Methodologies category. For comparison with the information above, the following table provides summary statistics for all permanent job vacancies requiring process or methodology skills in Scotland.

Permanent vacancies with a requirement for process or methodology skills 2,284 3,920 2,614
As % of all permanent jobs advertised in Scotland 89.92% 86.06% 95.82%
Number of salaries quoted 996 1,643 2,016
10th Percentile £26,625 £31,250 £25,000
25th Percentile £32,150 £41,479 £37,746
Median annual salary (50th Percentile) £38,000 £55,000 £52,500
Median % change year-on-year -30.91% +4.76% -4.55%
75th Percentile £61,250 £70,000 £70,000
90th Percentile £78,750 £81,250 £82,500
UK median annual salary £55,000 £57,500 £60,000
% change year-on-year -4.35% -4.17% -

DevOps
Job Vacancy Trend in Scotland

Job postings citing DevOps as a proportion of all IT jobs advertised in Scotland.

Job vacancy trend for DevOps in Scotland

DevOps
Salary Trend in Scotland

Salary distribution trend for jobs in Scotland citing DevOps.

Salary distribution trend for jobs in Scotland citing DevOps

DevOps
Salary Histogram in Scotland

Salary distribution for jobs citing DevOps in Scotland over the 6 months to 13 September 2025.

Salary histogram for DevOps in Scotland

DevOps
Job Locations in Scotland

The table below looks at the demand and provides a guide to the median salaries quoted in IT jobs citing DevOps within the Scotland region over the 6 months to 13 September 2025. The 'Rank Change' column provides an indication of the change in demand within each location based on the same 6 month period last year.

Location Rank Change
on Same Period
Last Year
Matching
Permanent
IT Job Ads
Median Salary
Past 6 Months
Median Salary
% Change
on Same Period
Last Year
Live
Jobs
Edinburgh +5 115 £67,500 - 51
Glasgow +30 37 £67,500 +10.20% 35
Lanarkshire -4 18 - - 14
West Lothian +3 4 - - 4
Renfrewshire - 4 - - 2
North Lanarkshire - 4 - -
Fife +4 3 £50,000 - 8
Stirling - 3 - -
West Dunbartonshire - 2 - -
East Ayrshire - 2 £85,700 - 1
South Ayrshire - 2 £85,700 - 1
Aberdeen +12 1 - - 7
Inverclyde -3 1 - -
Ayrshire - 1 - - 2
Clackmannanshire - 1 - -
Falkirk - 1 - -
South Lanarkshire - 1 - -
Moray - 1 - - 1
North Ayrshire - 1 - -
Strathclyde - 1 - -
DevOps
UK

DevOps
Co-occurring Skills and Capabilities in Scotland by Category

The follow tables expand on the table above by listing co-occurrences grouped by category. The same employment type, locality and period is covered with up to 20 co-occurrences shown in each of the following categories:

Application Platforms
1 62 (29.67%) Confluence
2 6 (2.87%) Oracle SOA Suite
2 6 (2.87%) SharePoint
3 5 (2.39%) Apache
3 5 (2.39%) Microsoft Exchange
4 4 (1.91%) Apache Spark
5 3 (1.44%) nginx
5 3 (1.44%) WebSphere
6 2 (0.96%) CICS
7 1 (0.48%) JBoss
Applications
1 9 (4.31%) Microsoft Excel
2 2 (0.96%) Chatbot
Business Applications
1 12 (5.74%) Oracle ERP
2 2 (0.96%) Dynamics NAV
3 1 (0.48%) Dynamics CRM
Cloud Services
1 154 (73.68%) Azure
2 95 (45.45%) AWS
3 79 (37.80%) GCP
4 63 (30.14%) Azure DevOps
5 38 (18.18%) GitHub
6 19 (9.09%) Entra ID
7 17 (8.13%) Power Platform
7 17 (8.13%) Snowflake
8 15 (7.18%) Microsoft 365
9 14 (6.70%) GitHub Actions
10 12 (5.74%) GitHub Copilot
10 12 (5.74%) OCI
11 10 (4.78%) OpenShift
12 9 (4.31%) SaaS
13 7 (3.35%) Azure Data Factory
14 6 (2.87%) Azure Monitor
14 6 (2.87%) dbt
15 5 (2.39%) Amazon EKS
15 5 (2.39%) Datadog
15 5 (2.39%) Microsoft Purview
Communications & Networking
1 9 (4.31%) DNS
1 9 (4.31%) Firewall
2 5 (2.39%) VPN
3 4 (1.91%) Network Security
3 4 (1.91%) Software-Defined Networking
4 3 (1.44%) BGP
4 3 (1.44%) Cisco IOS
4 3 (1.44%) F5 BIG-IP LTM
4 3 (1.44%) LAN
4 3 (1.44%) NX-OS
4 3 (1.44%) OSPF
4 3 (1.44%) TCP/IP
4 3 (1.44%) VXLAN
4 3 (1.44%) WAN
5 2 (0.96%) Broadband
5 2 (0.96%) DHCP
5 2 (0.96%) Kerberos
6 1 (0.48%) HTTP
6 1 (0.48%) SpaceWire
Database & Business Intelligence
1 52 (24.88%) SQL Server
2 16 (7.66%) Data Warehouse
3 15 (7.18%) Power BI
3 15 (7.18%) Tableau
4 10 (4.78%) NoSQL
5 5 (2.39%) Snowflake Schema
6 4 (1.91%) Azure SQL Database
6 4 (1.91%) Big Data
6 4 (1.91%) PostgreSQL
7 3 (1.44%) MongoDB
7 3 (1.44%) MySQL
7 3 (1.44%) Relational Database
8 2 (0.96%) Data Lake
8 2 (0.96%) DB2
9 1 (0.48%) Azure SQL Data Warehouse
9 1 (0.48%) Metadata
9 1 (0.48%) RDBMS
Development Applications
1 79 (37.80%) JIRA
2 62 (29.67%) GitLab
3 56 (26.79%) Maven
4 53 (25.36%) SonarQube
5 52 (24.88%) Sonatype Nexus
6 50 (23.92%) Bitbucket
6 50 (23.92%) Selenium
7 49 (23.44%) Cucumber
8 24 (11.48%) Jenkins
9 17 (8.13%) Git
10 12 (5.74%) Oracle Forms
11 6 (2.87%) JUnit
12 3 (1.44%) Gradle
12 3 (1.44%) Visual Studio
13 2 (0.96%) Cypress.io
13 2 (0.96%) Mockito
14 1 (0.48%) Ant
14 1 (0.48%) Artifactory
14 1 (0.48%) SoapUI
14 1 (0.48%) TestNG
General
1 129 (61.72%) Finance
2 61 (29.19%) Inclusion and Diversity
3 57 (27.27%) Banking
4 39 (18.66%) Social Skills
5 23 (11.00%) Analytical Skills
5 23 (11.00%) Marketing
6 11 (5.26%) Law
7 5 (2.39%) Games
8 4 (1.91%) Organisational Skills
8 4 (1.91%) Tech for Good
9 2 (0.96%) Back Office
9 2 (0.96%) Documentation Skills
9 2 (0.96%) Front Office
9 2 (0.96%) Health Technology
9 2 (0.96%) Investment Banking
9 2 (0.96%) Public Sector
10 1 (0.48%) Advertising
10 1 (0.48%) Legal
10 1 (0.48%) Retail
10 1 (0.48%) Telecoms
Job Titles
1 74 (35.41%) Software Engineer
2 38 (18.18%) Senior
3 21 (10.05%) Cloud Engineer
4 20 (9.57%) Lead
5 17 (8.13%) Analyst
6 14 (6.70%) Applications Engineer
6 14 (6.70%) Developer
7 12 (5.74%) Architect
7 12 (5.74%) Full-Stack Engineer
7 12 (5.74%) Full-Stack Software Engineer
8 11 (5.26%) DevOps Engineer
9 10 (4.78%) Infrastructure Engineer
9 10 (4.78%) Senior Cloud Engineer
9 10 (4.78%) Senior Software Engineer
10 9 (4.31%) Azure Engineer
11 8 (3.83%) .NET Software Engineer
11 8 (3.83%) C# Software Engineer
11 8 (3.83%) Lead Software Engineer
11 8 (3.83%) Senior Developer
12 7 (3.35%) Java Developer
Libraries, Frameworks & Software Standards
1 71 (33.97%) React
2 62 (29.67%) Spring
3 61 (29.19%) Spring Boot
4 57 (27.27%) Kafka
5 54 (25.84%) Hibernate
6 52 (24.88%) CSS
6 52 (24.88%) JPA
7 51 (24.40%) HTML
8 49 (23.44%) Redux
9 29 (13.88%) RESTful
10 15 (7.18%) .NET
11 14 (6.70%) AngularJS
12 12 (5.74%) Middleware
13 10 (4.78%) OAuth
13 10 (4.78%) OAuth2
14 9 (4.31%) Blazor
14 9 (4.31%) JSON
14 9 (4.31%) SOAP
14 9 (4.31%) XML
15 8 (3.83%) SAML
Miscellaneous
1 83 (39.71%) Product Ownership
2 64 (30.62%) Enterprise Software
3 27 (12.92%) Cloud Native
4 13 (6.22%) Management Information System
5 12 (5.74%) Analytical Mindset
5 12 (5.74%) Onboarding
6 11 (5.26%) Distributed Systems
7 6 (2.87%) Public Cloud
8 5 (2.39%) Algorithms
8 5 (2.39%) Virtual Team
9 4 (1.91%) Self-Motivation
10 3 (1.44%) Data Centre
10 3 (1.44%) Mainframe
10 3 (1.44%) Private Cloud
11 2 (0.96%) Embedded Systems
11 2 (0.96%) NHS
11 2 (0.96%) SWIFT Messaging Network
12 1 (0.48%) Driving Licence
12 1 (0.48%) Hybrid Cloud
12 1 (0.48%) Mobile App
Operating Systems
1 8 (3.83%) Linux
2 6 (2.87%) Windows
3 4 (1.91%) VMS
4 3 (1.44%) Unix
5 1 (0.48%) Red Hat Enterprise Linux
5 1 (0.48%) zOS
Processes & Methodologies
1 155 (74.16%) Agile
2 131 (62.68%) CI/CD
3 110 (52.63%) Continuous Improvement
4 89 (42.58%) Test Automation
5 84 (40.19%) Software Engineering
6 78 (37.32%) Containerisation
7 77 (36.84%) Microservices
8 70 (33.49%) Full-Stack Development
9 65 (31.10%) Clean Code
9 65 (31.10%) Coaching
10 64 (30.62%) SDLC
11 57 (27.27%) Front End Development
12 56 (26.79%) Asset Management
12 56 (26.79%) TDD
13 49 (23.44%) Performance Optimisation
14 42 (20.10%) Artificial Intelligence
15 35 (16.75%) Roadmaps
16 32 (15.31%) Analytics
17 31 (14.83%) Mentoring
18 30 (14.35%) Problem-Solving
Programming Languages
1 97 (46.41%) SQL
2 93 (44.50%) Java
3 67 (32.06%) JavaScript
4 61 (29.19%) Python
5 18 (8.61%) PowerShell
6 16 (7.66%) Bash
7 14 (6.70%) Shell Script
8 13 (6.22%) C#
9 12 (5.74%) PL/SQL
10 6 (2.87%) Bicep
11 5 (2.39%) TypeScript
12 4 (1.91%) Go
13 3 (1.44%) Apex Code
13 3 (1.44%) C
13 3 (1.44%) C++
13 3 (1.44%) Groovy
14 2 (0.96%) SOQL
14 2 (0.96%) SOSL
15 1 (0.48%) PHP
15 1 (0.48%) Scala
Qualifications
1 12 (5.74%) Degree
2 10 (4.78%) Computer Science Degree
3 4 (1.91%) BPSS Clearance
3 4 (1.91%) Chartered Engineer
4 3 (1.44%) CCNA
4 3 (1.44%) CCNP
4 3 (1.44%) Cisco Certification
5 1 (0.48%) ISTQB
5 1 (0.48%) Microsoft Certification
5 1 (0.48%) SC Cleared
5 1 (0.48%) Security Cleared
Quality Assurance & Compliance
1 60 (28.71%) QA
2 10 (4.78%) Accessibility
3 4 (1.91%) Data Quality
3 4 (1.91%) ISO/IEC 12207
4 3 (1.44%) ISO 20022
5 2 (0.96%) ISO 9001
5 2 (0.96%) ISO/IEC 27001
5 2 (0.96%) Sarbanes-Oxley
5 2 (0.96%) SEPA
6 1 (0.48%) ECSS
6 1 (0.48%) GDPR
System Software
1 89 (42.58%) Docker
2 10 (4.78%) Active Directory
3 6 (2.87%) Virtual Machines
4 5 (2.39%) Virtual Desktop
5 3 (1.44%) RACF
6 2 (0.96%) Virtual Servers
7 1 (0.48%) NDS
7 1 (0.48%) VMware Infrastructure
7 1 (0.48%) VMware NSX
Systems Management
1 97 (46.41%) Kubernetes
2 47 (22.49%) Terraform
3 12 (5.74%) Single Sign-On
4 9 (4.31%) Ansible
4 9 (4.31%) Grafana
5 7 (3.35%) Prometheus
6 5 (2.39%) Microsoft Intune
7 2 (0.96%) Argo
7 2 (0.96%) Istio
7 2 (0.96%) Puppet
8 1 (0.48%) CA Single Sign-On
8 1 (0.48%) Opsgenie
8 1 (0.48%) PingFederate
8 1 (0.48%) Podman
8 1 (0.48%) Progress Chef
Vendors
1 49 (23.44%) Solace
2 26 (12.44%) Microsoft
3 14 (6.70%) Oracle
4 7 (3.35%) Okta
4 7 (3.35%) Splunk
5 5 (2.39%) IBM
6 4 (1.91%) Cisco
6 4 (1.91%) F5
6 4 (1.91%) Salesforce
7 3 (1.44%) ServiceNow
8 2 (0.96%) Broadcom
8 2 (0.96%) ForgeRock
8 2 (0.96%) Fortinet
8 2 (0.96%) Ping Identity
8 2 (0.96%) VMware
9 1 (0.48%) Ab Initio
9 1 (0.48%) Google
9 1 (0.48%) NetIQ
9 1 (0.48%) Planview
9 1 (0.48%) SolarWinds