Banking
Staffordshire > Stoke-on-Trent
The table below looks at the prevalence of the term Banking in permanent job vacancies in Stoke-on-Trent. Included is a benchmarking guide to the salaries offered in vacancies that cited Banking over the 6 months leading up to 28 May 2025, comparing them to the same period in the previous two years.
| 6 months to 28 May 2025 |
Same period 2024 | Same period 2023 | |
|---|---|---|---|
| Rank | 18 | - | - |
| Rank change year-on-year | - | - | - |
| Permanent jobs citing Banking | 8 | 0 | 0 |
| As % of all permanent jobs advertised in Stoke-on-Trent | 7.69% | - | - |
| As % of the General category | 11.94% | - | - |
| Number of salaries quoted | 2 | 0 | 0 |
| Median annual salary (50th Percentile) | £26,968 | - | - |
| Staffordshire median annual salary | £26,968 | - | - |
All General Skills
Stoke-on-Trent
Banking falls under the General Skills category. For comparison with the information above, the following table provides summary statistics for all permanent job vacancies requiring common skills in Stoke-on-Trent.
| Permanent vacancies with a requirement for common skills | 67 | 212 | 163 |
| As % of all permanent jobs advertised in Stoke-on-Trent | 64.42% | 57.61% | 74.09% |
| Number of salaries quoted | 35 | 186 | 123 |
| 10th Percentile | £28,000 | £21,500 | £23,500 |
| 25th Percentile | £32,500 | £25,075 | £32,500 |
| Median annual salary (50th Percentile) | £35,000 | £32,500 | £40,500 |
| Median % change year-on-year | +7.69% | -19.75% | +8.00% |
| 75th Percentile | £39,375 | £48,750 | £58,750 |
| 90th Percentile | £45,450 | £61,500 | £67,500 |
| Staffordshire median annual salary | £45,000 | £40,000 | £43,250 |
| % change year-on-year | +12.50% | -7.51% | -3.89% |
Banking
Job Vacancy Trend in Stoke-on-Trent
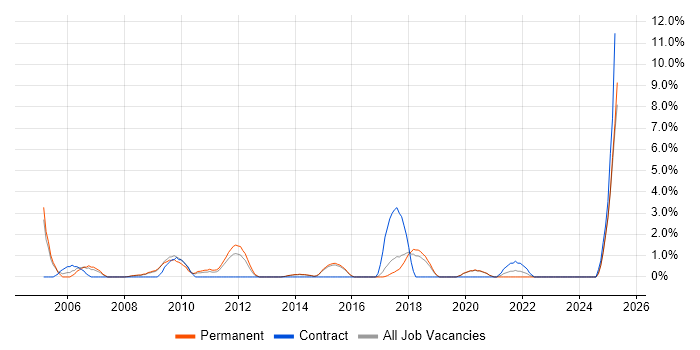
Job postings citing Banking as a proportion of all IT jobs advertised in Stoke-on-Trent.

Banking
Salary Trend in Stoke-on-Trent
3-month moving average salary quoted in jobs citing Banking in Stoke-on-Trent.
Banking
Co-occurring Skills and Capabilities in Stoke-on-Trent by Category
The follow tables expand on the table above by listing co-occurrences grouped by category. The same employment type, locality and period is covered with up to 20 co-occurrences shown in each of the following categories:
