Security Cleared Contracts in Bristol

Security Clearance
South West > Bristol

The table below provides summary statistics for contract job vacancies advertised in Bristol with a requirement for Security Cleared qualifications. It includes a benchmarking guide to the contractor rates offered over the 6 months leading up to 18 August 2025, comparing them to the same period in the previous two years.

6 months to
18 Aug 2025
Same period 2024 Same period 2023
Rank 1 1 1
Rank change year-on-year 0 0 0
Contract jobs citing Security Cleared 223 345 351
As % of all contract jobs advertised in Bristol 32.27% 36.70% 32.74%
As % of the Qualifications category 76.90% 87.34% 82.01%
Number of daily rates quoted 104 159 230
10th Percentile £313 £369 £359
25th Percentile £409 £450 £500
Median daily rate (50th Percentile) £500 £550 £600
Median % change year-on-year -9.09% -8.33% +9.09%
75th Percentile £600 £649 £688
90th Percentile £725 £753 £775
South West median daily rate £575 £570 £575
% change year-on-year +0.88% -0.87% +2.22%
Number of hourly rates quoted 49 103 46
10th Percentile £18.20 £55.00 £55.00
25th Percentile £22.63 £65.63 £58.99
Median hourly rate £35.00 £70.00 £73.75
Median % change year-on-year -50.00% -5.08% +14.34%
75th Percentile £68.75 £75.00 £83.40
90th Percentile £80.59 £80.00 £91.88
South West median hourly rate £25.15 £70.00 £70.00
% change year-on-year -64.07% - +9.38%

All Academic and Professional Certifications
Bristol

Security Cleared falls under the Academic Qualifications and Professional Certifications category. For comparison with the information above, the following table provides summary statistics for all contract job vacancies requiring academic qualifications or professional certifications in Bristol.

Contract vacancies requiring academic qualifications or professional certifications 290 395 428
As % of all contract IT jobs advertised in Bristol 41.97% 42.02% 39.93%
Number of daily rates quoted 158 187 273
10th Percentile £213 £334 £333
25th Percentile £355 £425 £463
Median daily rate (50th Percentile) £450 £525 £588
Median % change year-on-year -14.29% -10.64% +11.90%
75th Percentile £575 £638 £680
90th Percentile £716 £750 £773
South West median daily rate £550 £550 £575
% change year-on-year - -4.35% +4.55%
Number of hourly rates quoted 51 109 56
10th Percentile £18.22 £43.75 £33.00
25th Percentile £22.63 £63.75 £55.94
Median hourly rate £35.00 £70.00 £68.75
Median % change year-on-year -50.00% +1.82% +14.58%
75th Percentile £68.38 £75.00 £83.40
90th Percentile £80.00 £80.00 £90.00
South West median hourly rate £25.15 £70.00 £64.57
% change year-on-year -64.07% +8.41% +7.62%

Security Cleared
Job Vacancy Trend in Bristol

Job postings citing Security Cleared as a proportion of all IT jobs advertised in Bristol.
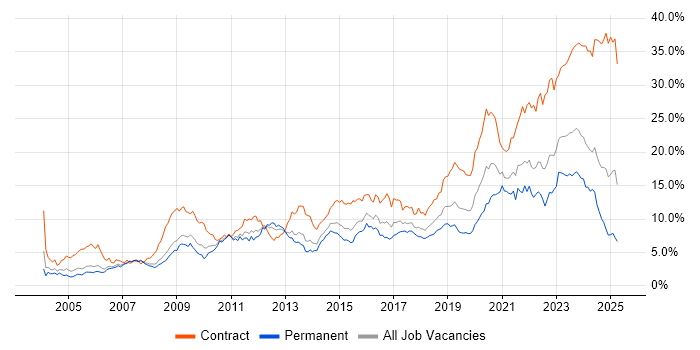
Job vacancy trend for Security Cleared in Bristol

Security Cleared
Contractor Daily Rate Trend in Bristol

3-month moving average daily rate quoted in jobs citing Security Cleared in Bristol.

Daily rate trend for Security Cleared in Bristol

Security Cleared
Daily Rate Histogram in Bristol

Daily rate distribution for jobs citing Security Cleared in Bristol over the 6 months to 18 August 2025.

Daily rate histogram for Security Cleared in Bristol

Security Cleared
Contractor Hourly Rate Trend in Bristol

3-month moving average hourly rates quoted in jobs citing Security Cleared in Bristol.

Hourly rate trend for Security Cleared in Bristol

Security Cleared
Hourly Rate Histogram in Bristol

Hourly rate distribution of jobs citing Security Cleared in Bristol over the 6 months to 18 August 2025.

Hourly rate histogram for Security Cleared in Bristol

Security Cleared
Co-occurring Skills and Capabilities in Bristol by Category

The follow tables expand on the table above by listing co-occurrences grouped by category. The same employment type, locality and period is covered with up to 20 co-occurrences shown in each of the following categories:

Application Platforms
1 9 (4.04%) Apache
2 2 (0.90%) Apache Spark
3 1 (0.45%) Microsoft Exchange
3 1 (0.45%) SharePoint
3 1 (0.45%) Skype for Business
Applications
1 15 (6.73%) Microsoft Excel
2 6 (2.69%) Microsoft Project
3 2 (0.90%) Microsoft PowerPoint
3 2 (0.90%) Simulink
3 2 (0.90%) Stateflow
Business Applications
1 5 (2.24%) Primavera
2 2 (0.90%) Oracle Payroll
3 1 (0.45%) Oracle Applications
3 1 (0.45%) Oracle ERP
3 1 (0.45%) Teamcenter
Cloud Services
1 25 (11.21%) Azure
2 18 (8.07%) AWS
3 9 (4.04%) SaaS
4 8 (3.59%) Microsoft 365
4 8 (3.59%) PaaS
5 7 (3.14%) OCI
6 4 (1.79%) GCP
6 4 (1.79%) Power Automate
7 3 (1.35%) Azure DevOps
7 3 (1.35%) Google Sheets
8 2 (0.90%) OpenShift
9 1 (0.45%) Azure AKS
9 1 (0.45%) Azure Cosmos DB
9 1 (0.45%) Boomi
9 1 (0.45%) Entra ID
9 1 (0.45%) GitHub
9 1 (0.45%) IaaS
9 1 (0.45%) Salesforce Sales Cloud
9 1 (0.45%) Salesforce Service Cloud
9 1 (0.45%) Smartsheet
Communications & Networking
1 13 (5.83%) Firewall
2 8 (3.59%) VoIP
3 7 (3.14%) PBX
3 7 (3.14%) WAN
4 6 (2.69%) 5G
4 6 (2.69%) LAN
5 5 (2.24%) LTE
6 4 (1.79%) DNS
6 4 (1.79%) HTTP
6 4 (1.79%) Network Security
7 3 (1.35%) BGP
7 3 (1.35%) OSPF
8 2 (0.90%) 4G
8 2 (0.90%) Cisco Nexus
8 2 (0.90%) EIGRP
8 2 (0.90%) HSRP
8 2 (0.90%) VPN
8 2 (0.90%) VRRP
8 2 (0.90%) WLAN
9 1 (0.45%) TCP/IP
Database & Business Intelligence
1 5 (2.24%) Elasticsearch
2 4 (1.79%) Relational Database
3 3 (1.35%) Oracle Database
4 2 (0.90%) Hadoop
4 2 (0.90%) Redis
5 1 (0.45%) Amazon RDS
5 1 (0.45%) Big Data
5 1 (0.45%) Geospatial Data
5 1 (0.45%) MySQL
5 1 (0.45%) PostgreSQL
5 1 (0.45%) Scylla
5 1 (0.45%) SQL Server
5 1 (0.45%) Tableau
Development Applications
1 13 (5.83%) Git
2 7 (3.14%) JIRA
3 4 (1.79%) GitLab
3 4 (1.79%) Jenkins
4 3 (1.35%) Artifactory
4 3 (1.35%) Oracle APEX
4 3 (1.35%) Rational DOORS
5 2 (0.90%) Rational Team Concert
6 1 (0.45%) Bitbucket
6 1 (0.45%) CMake
6 1 (0.45%) GoogleTest
6 1 (0.45%) Rational Rhapsody
General
1 57 (25.56%) Public Sector
2 44 (19.73%) Social Skills
3 15 (6.73%) Analytical Skills
4 14 (6.28%) Telecoms
5 12 (5.38%) Finance
6 6 (2.69%) Military
7 5 (2.24%) Aerospace
7 5 (2.24%) Aviation
7 5 (2.24%) Influencing Skills
7 5 (2.24%) Organisational Skills
8 4 (1.79%) Polish Language
9 3 (1.35%) Back Office
9 3 (1.35%) Documentation Skills
9 3 (1.35%) Manufacturing
9 3 (1.35%) Marketing
10 2 (0.90%) Electronics
10 2 (0.90%) Fire and Rescue
10 2 (0.90%) Law
10 2 (0.90%) Police
10 2 (0.90%) Presentation Skills
Job Titles
1 39 (17.49%) Architect
2 21 (9.42%) Developer
3 17 (7.62%) Analyst
4 14 (6.28%) Consultant
4 14 (6.28%) Desktop Support
5 13 (5.83%) Project Manager
5 13 (5.83%) Support Analyst
6 11 (4.93%) Security Manager
7 10 (4.48%) IT Support
7 10 (4.48%) Senior
8 8 (3.59%) Lead
8 8 (3.59%) Software Engineer
9 7 (3.14%) DevOps Engineer
9 7 (3.14%) Project Planner
9 7 (3.14%) Solutions Architect
9 7 (3.14%) Technical Architect
10 6 (2.69%) Deskside Analyst
10 6 (2.69%) Deskside Support
10 6 (2.69%) Deskside Support Analyst
10 6 (2.69%) Service Architect
Libraries, Frameworks & Software Standards
1 11 (4.93%) React
2 8 (3.59%) Apache NiFi
2 8 (3.59%) Middleware
3 7 (3.14%) OpenID
3 7 (3.14%) Oracle Fusion
3 7 (3.14%) Qt
4 6 (2.69%) FastAPI
4 6 (2.69%) XML
5 4 (1.79%) AngularJS
5 4 (1.79%) Elastic Stack
5 4 (1.79%) JMS
5 4 (1.79%) SOAP
5 4 (1.79%) XSD
6 3 (1.35%) Next.js
6 3 (1.35%) Node.js
6 3 (1.35%) REST
7 2 (0.90%) Hugging Face
7 2 (0.90%) Kafka
7 2 (0.90%) Lightning Web Components
7 2 (0.90%) PyTorch
Miscellaneous
1 7 (3.14%) Management Information System
2 6 (2.69%) Blackberry
2 6 (2.69%) Data Centre
2 6 (2.69%) Driving Licence
2 6 (2.69%) Onboarding
2 6 (2.69%) Product Ownership
2 6 (2.69%) Replication
2 6 (2.69%) Video Conferencing
3 5 (2.24%) Self-Motivation
4 4 (1.79%) Cyber Threat
5 3 (1.35%) Cloud Native
5 3 (1.35%) Linux Command Line
5 3 (1.35%) Security Operations Centre
6 2 (0.90%) Algorithms
6 2 (0.90%) FPGA
6 2 (0.90%) Verilog
6 2 (0.90%) VHDL
7 1 (0.45%) Data Protection Act
7 1 (0.45%) PKI
7 1 (0.45%) Robotics
Operating Systems
1 20 (8.97%) Windows
2 17 (7.62%) Linux
3 5 (2.24%) Windows 7
4 3 (1.35%) Red Hat Enterprise Linux
4 3 (1.35%) Ubuntu
4 3 (1.35%) Windows 10
4 3 (1.35%) Windows Server
5 1 (0.45%) Android
5 1 (0.45%) Robot Operating System
5 1 (0.45%) Unix
Processes & Methodologies
1 27 (12.11%) ITIL
2 26 (11.66%) Agile
3 24 (10.76%) DevOps
4 22 (9.87%) Project Management
5 20 (8.97%) Project Delivery
5 20 (8.97%) Stakeholder Management
6 18 (8.07%) Cybersecurity
6 18 (8.07%) Service Management
6 18 (8.07%) Software Engineering
7 17 (7.62%) Migration
8 16 (7.17%) Decision-Making
9 15 (6.73%) Problem-Solving
9 15 (6.73%) Roadmaps
10 13 (5.83%) Customer Service
10 13 (5.83%) ITSM
10 13 (5.83%) Stakeholder Engagement
10 13 (5.83%) Workflow
11 12 (5.38%) Root Cause Analysis
11 12 (5.38%) Validation
12 11 (4.93%) CI/CD
Programming Languages
1 21 (9.42%) Python
2 16 (7.17%) C++
3 13 (5.83%) Ada
4 11 (4.93%) C#
5 10 (4.48%) SQL
6 8 (3.59%) C
7 7 (3.14%) JavaScript
7 7 (3.14%) TypeScript
8 5 (2.24%) Bash
9 4 (1.79%) PowerShell
9 4 (1.79%) Shell Script
10 3 (1.35%) Perl
10 3 (1.35%) PL/SQL
11 2 (0.90%) Fortran
11 2 (0.90%) Go
11 2 (0.90%) MATLAB
12 1 (0.45%) Apex Code
12 1 (0.45%) Bicep
12 1 (0.45%) PHP
12 1 (0.45%) SOQL
Qualifications
1 164 (73.54%) SC Cleared
2 48 (21.52%) DV Cleared
3 9 (4.04%) Microsoft Certification
4 7 (3.14%) BPSS Clearance
4 7 (3.14%) CCNP
4 7 (3.14%) Cisco Certification
5 6 (2.69%) VMware Certified Professional (VCP)
6 5 (2.24%) Degree
7 3 (1.35%) CISA
7 3 (1.35%) CISM
7 3 (1.35%) CISSP
7 3 (1.35%) Computer Science Degree
8 2 (0.90%) CRISC
8 2 (0.90%) ISACA
8 2 (0.90%) PRINCE2 Practitioner
9 1 (0.45%) A+ Certification
9 1 (0.45%) CCNA
9 1 (0.45%) CTC Cleared
9 1 (0.45%) ITIL Certification
9 1 (0.45%) Network+ Certification
Quality Assurance & Compliance
1 10 (4.48%) QA
2 8 (3.59%) Def Stans
2 8 (3.59%) NIST
3 7 (3.14%) IEC 61508
3 7 (3.14%) MISRA
3 7 (3.14%) MISRA C
4 5 (2.24%) SLA
5 3 (1.35%) Data Quality
5 3 (1.35%) ISO/IEC 27001
5 3 (1.35%) NCSC
5 3 (1.35%) PMO
6 2 (0.90%) JSP 440
7 1 (0.45%) Government Security Classifications
7 1 (0.45%) GRC
7 1 (0.45%) PMBOK
System Software
1 15 (6.73%) Docker
2 11 (4.93%) VMware Infrastructure
3 4 (1.79%) Active Directory
4 1 (0.45%) Hyper-V
4 1 (0.45%) Virtual Desktop
4 1 (0.45%) VMware ESXi
4 1 (0.45%) VMware Workstation
Systems Management
1 15 (6.73%) Terraform
2 14 (6.28%) Kubernetes
3 11 (4.93%) Grafana
4 10 (4.48%) Ansible
5 9 (4.04%) Prometheus
6 6 (2.69%) MIIS
7 5 (2.24%) Kibana
8 4 (1.79%) logstash
9 2 (0.90%) Cisco Prime
10 1 (0.45%) Data Guard
10 1 (0.45%) Microsoft Intune
10 1 (0.45%) Oracle Enterprise Manager
10 1 (0.45%) Oracle RMAN
10 1 (0.45%) Progress Chef
10 1 (0.45%) Red Hat Satellite
10 1 (0.45%) SCCM
10 1 (0.45%) SCOM
10 1 (0.45%) yum
Vendors
1 35 (15.70%) Microsoft
2 20 (8.97%) Oracle
3 16 (7.17%) VMware
4 14 (6.28%) ServiceNow
5 10 (4.48%) Cisco
6 9 (4.04%) SAP
7 8 (3.59%) Juniper
8 7 (3.14%) Dell
8 7 (3.14%) Ericsson
8 7 (3.14%) F5
8 7 (3.14%) Nokia
8 7 (3.14%) Palo Alto
8 7 (3.14%) Red Hat
9 6 (2.69%) Avaya
9 6 (2.69%) HP
9 6 (2.69%) Ribbon
10 5 (2.24%) Blue Prism
11 4 (1.79%) Google
11 4 (1.79%) Twitter
12 3 (1.35%) Computacenter