iManage Contracts in the City of London

iManage
Central London > City of London

The table below provides summary statistics for contract job vacancies advertised in the City of London with a requirement for knowledge and experience of iManage products and/or services. Included is a benchmarking guide to the contractor rates offered in vacancies that have cited iManage over the 6 months to 25 April 2024 with a comparison to the same period in the previous 2 years.

The figures below represent the IT contractor job market in general and are not representative of contractor rates within iManage (WorkSite, FileSite).

6 months to
25 Apr 2024
Same period 2023 Same period 2022
Rank 116 170 191
Rank change year-on-year +54 +21 -49
Contract jobs citing iManage 13 2 2
As % of all contract jobs advertised in the City of London 0.59% 0.055% 0.047%
As % of the Vendors category 1.36% 0.14% 0.13%
Number of daily rates quoted 3 2 2
10th Percentile - £460 £175
25th Percentile - £475 £178
Median daily rate (50th Percentile) £250 £500 £188
Median % change year-on-year -50.00% +165.78% -55.74%
75th Percentile £463 £525 £200
90th Percentile £590 £540 £204
Central London median daily rate £340 £450 £188
% change year-on-year -24.44% +139.20% -55.74%

All Vendors
City of London

iManage is in the Vendor Products and Services category. The following table is for comparison with the above and provides summary statistics for all contract job vacancies with a requirement for knowledge or experience of vendor products and services advertised in the City of London.

Contract vacancies with a requirement for knowledge or experience of vendor products and services 955 1,426 1,554
As % of all contract IT jobs advertised in the City of London 42.98% 39.11% 36.79%
Number of daily rates quoted 701 936 1,178
10th Percentile £313 £263 £347
25th Percentile £430 £450 £463
Median daily rate (50th Percentile) £550 £560 £550
Median % change year-on-year -1.79% +1.82% +4.76%
75th Percentile £680 £700 £650
90th Percentile £775 £800 £738
Central London median daily rate £550 £550 £550
% change year-on-year - - +5.77%
Number of hourly rates quoted 6 7 21
10th Percentile £12.75 £16.27 -
25th Percentile £13.56 £18.42 £13.88
Median hourly rate £19.75 £21.00 £21.00
Median % change year-on-year -5.95% - +33.02%
75th Percentile £23.75 £36.97 £44.50
90th Percentile £25.38 £53.15 £50.75
Central London median hourly rate £18.93 £21.00 £21.00
% change year-on-year -9.86% - +12.00%

iManage
Job Vacancy Trend in the City of London

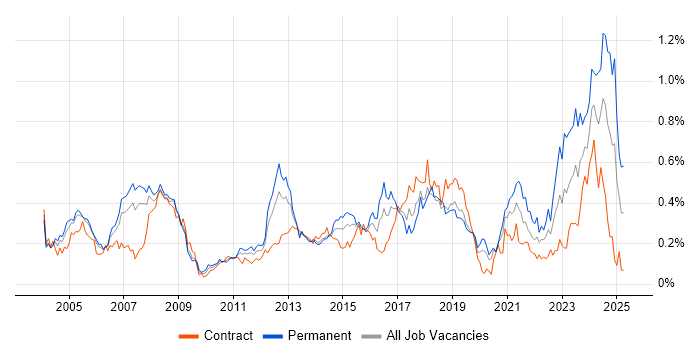
Job postings citing iManage as a proportion of all IT jobs advertised in the City of London.

Job vacancy trend for iManage in the City of London

iManage
Contractor Daily Rate Trend in the City of London

3-month moving average daily rate quoted in jobs citing iManage in the City of London.

Daily rate trend for iManage in the City of London

iManage
Daily Rate Histogram in the City of London

Daily rate distribution for jobs citing iManage in the City of London over the 6 months to 25 April 2024.

Daily rate histogram for iManage in the City of London

iManage
Contractor Hourly Rate Trend in the City of London

3-month moving average hourly rates quoted in jobs citing iManage in the City of London.

Hourly rate trend for iManage in the City of London

iManage
Co-occurring Skills and Capabilities in the City of London by Category

The follow tables expand on the table above by listing co-occurrences grouped by category. The same employment type, locality and period is covered with up to 20 co-occurrences shown in each of the following categories:

Application Platforms
1 3 (23.08%) SharePoint
Applications
1 5 (38.46%) Microsoft Office
2 3 (23.08%) Adobe Premiere
Business Applications
1 1 (7.69%) Carpe Diem
1 1 (7.69%) Dynamics CRM
1 1 (7.69%) Elite 3E
Cloud Services
1 8 (61.54%) Microsoft 365
2 6 (46.15%) Power Platform
Communications & Networking
1 3 (23.08%) H.323
2 1 (7.69%) Intranet
Database & Business Intelligence
1 6 (46.15%) SQL Server
1 6 (46.15%) SQL Server Integration Services
1 6 (46.15%) SQL Server Reporting Services
2 1 (7.69%) IDOL
2 1 (7.69%) MongoDB
2 1 (7.69%) NoSQL
General
1 11 (84.62%) Legal
2 10 (76.92%) Social Skills
3 3 (23.08%) Law
4 2 (15.38%) Finance
5 1 (7.69%) Billing
5 1 (7.69%) General Ledger
5 1 (7.69%) Marketing
5 1 (7.69%) Public Speaking
Job Titles
1 5 (38.46%) DevOps Manager
2 3 (23.08%) Audio Visual Engineer
3 1 (7.69%) Coordinator
3 1 (7.69%) Development Manager
3 1 (7.69%) IT Engineer
3 1 (7.69%) IT Trainer
3 1 (7.69%) Operations Engineer
3 1 (7.69%) Project Coordinator
3 1 (7.69%) Support Engineer
3 1 (7.69%) Trainer
Miscellaneous
1 3 (23.08%) Blackberry
1 3 (23.08%) Video Conferencing
2 1 (7.69%) Enterprise Software
2 1 (7.69%) Management Information System
2 1 (7.69%) PMI
Operating Systems
1 4 (30.77%) Windows
2 3 (23.08%) Windows 10
3 1 (7.69%) Windows Server
3 1 (7.69%) Windows Server 2016
Processes & Methodologies
1 7 (53.85%) Case Management
2 6 (46.15%) Agile
2 6 (46.15%) Continuous Improvement
2 6 (46.15%) Data Analysis
2 6 (46.15%) DevOps
2 6 (46.15%) ETL
2 6 (46.15%) Problem-Solving
3 3 (23.08%) Document Management
4 2 (15.38%) Stakeholder Management
4 2 (15.38%) Workflow
5 1 (7.69%) Change Management
5 1 (7.69%) Configuration Management
5 1 (7.69%) CRM
5 1 (7.69%) Logistics
5 1 (7.69%) PRINCE2
5 1 (7.69%) Project Management
5 1 (7.69%) Risk Management
5 1 (7.69%) Risk Register
5 1 (7.69%) Stakeholder Engagement
5 1 (7.69%) Workflow Management
Programming Languages
1 7 (53.85%) PowerShell
2 6 (46.15%) C#
2 6 (46.15%) T-SQL
3 1 (7.69%) SQL
Qualifications
1 3 (23.08%) Degree
2 1 (7.69%) APMP
2 1 (7.69%) PMI Certification
2 1 (7.69%) PMP
Quality Assurance & Compliance
1 7 (53.85%) SLA
2 1 (7.69%) P3O
2 1 (7.69%) PMO
Vendors
1 10 (76.92%) Microsoft
2 6 (46.15%) Cadence
3 3 (23.08%) Adobe
3 3 (23.08%) Cisco
3 3 (23.08%) Citrix
3 3 (23.08%) Tandberg
4 2 (15.38%) Intapp