Legal Contracts in the City of London

Legal
Central London > City of London

The table below looks at the prevalence of the term Legal in contract job vacancies in the City of London. Included is a benchmarking guide to the contractor rates offered in vacancies that cited Legal over the 6 months leading up to 31 May 2025, comparing them to the same period in the previous two years.

6 months to
31 May 2025
Same period 2024 Same period 2023
Rank 74 65 93
Rank change year-on-year -9 +28 -37
Contract jobs citing Legal 42 60 75
As % of all contract jobs advertised in the City of London 2.47% 2.79% 2.17%
As % of the General category 3.44% 4.16% 3.46%
Number of daily rates quoted 29 36 41
10th Percentile £212 £325 £245
25th Percentile £463 £509 £431
Median daily rate (50th Percentile) £575 £565 £570
Median % change year-on-year +1.77% -0.88% -0.87%
75th Percentile £700 £681 £713
90th Percentile £821 £813 £800
Central London median daily rate £575 £565 £525
% change year-on-year +1.77% +7.62% -8.70%

All General Skills
City of London

Legal falls under the General Skills category. For comparison with the information above, the following table provides summary statistics for all contract job vacancies requiring common skills in the City of London.

Contract vacancies with a requirement for common skills 1,221 1,442 2,167
As % of all contract IT jobs advertised in the City of London 71.91% 67.01% 62.79%
Number of daily rates quoted 766 1,005 1,531
10th Percentile £338 £338 £363
25th Percentile £438 £450 £500
Median daily rate (50th Percentile) £550 £575 £625
Median % change year-on-year -4.35% -8.00% +9.65%
75th Percentile £688 £688 £738
90th Percentile £775 £800 £825
Central London median daily rate £557 £550 £600
% change year-on-year +1.33% -8.33% +7.14%
Number of hourly rates quoted 13 6 11
10th Percentile £17.60 £17.96 £14.25
25th Percentile £24.66 £19.99 £14.88
Median hourly rate £28.50 £20.82 £20.71
Median % change year-on-year +36.92% +0.53% -45.51%
75th Percentile £43.75 £25.60 £47.54
90th Percentile £92.75 £38.63 £53.75
Central London median hourly rate £29.07 £23.80 £35.00
% change year-on-year +22.14% -32.00% -7.89%

Legal
Job Vacancy Trend in the City of London

Job postings citing Legal as a proportion of all IT jobs advertised in the City of London.
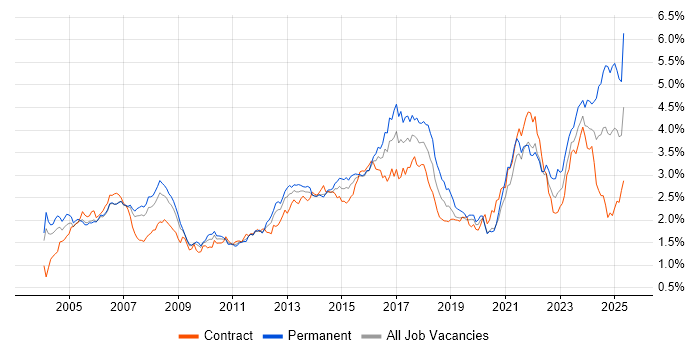
Job vacancy trend for Legal in the City of London

Legal
Contractor Daily Rate Trend in the City of London

3-month moving average daily rate quoted in jobs citing Legal in the City of London.

Daily rate trend for Legal in the City of London

Legal
Daily Rate Histogram in the City of London

Daily rate distribution for jobs citing Legal in the City of London over the 6 months to 31 May 2025.

Daily rate histogram for Legal in the City of London

Legal
Contractor Hourly Rate Trend in the City of London

3-month moving average hourly rates quoted in jobs citing Legal in the City of London.

Hourly rate trend for Legal in the City of London

Legal
Co-occurring Skills and Capabilities in the City of London by Category

The follow tables expand on the table above by listing co-occurrences grouped by category. The same employment type, locality and period is covered with up to 20 co-occurrences shown in each of the following categories:

Application Platforms
1 2 (4.76%) CMS
1 2 (4.76%) Confluence
1 2 (4.76%) Microsoft Exchange
1 2 (4.76%) SharePoint
2 1 (2.38%) ArcGIS
Applications
1 7 (16.67%) Microsoft Excel
2 5 (11.90%) Microsoft PowerPoint
3 2 (4.76%) Trello
4 1 (2.38%) Chatbot
4 1 (2.38%) Microsoft Office
4 1 (2.38%) Microsoft Project
4 1 (2.38%) MS Visio
Business Applications
1 1 (2.38%) Orchestrade
1 1 (2.38%) SAP S/4HANA
Cloud Services
1 6 (14.29%) Azure
2 2 (4.76%) AWS
2 2 (4.76%) Microsoft 365
3 1 (2.38%) Collibra
3 1 (2.38%) Figma
3 1 (2.38%) Google Docs
3 1 (2.38%) SaaS
Database & Business Intelligence
1 3 (7.14%) Data Warehouse
2 2 (4.76%) Data Lake
2 2 (4.76%) SQL Server
3 1 (2.38%) BusinessObjects
3 1 (2.38%) GIS
3 1 (2.38%) Metadata
3 1 (2.38%) MS Access
3 1 (2.38%) Tableau
Development Applications
1 2 (4.76%) JIRA
General
1 23 (54.76%) Finance
2 18 (42.86%) Social Skills
3 9 (21.43%) Law
4 7 (16.67%) Analytical Skills
5 6 (14.29%) Front Office
6 4 (9.52%) Banking
6 4 (9.52%) Influencing Skills
7 3 (7.14%) Financial Institution
8 2 (4.76%) Organisational Skills
8 2 (4.76%) Presentation Skills
8 2 (4.76%) Telecoms
9 1 (2.38%) Corporate Banking
9 1 (2.38%) Inclusion and Diversity
9 1 (2.38%) International Banking
9 1 (2.38%) Marketing
9 1 (2.38%) Private Banking
9 1 (2.38%) Public Sector
Job Titles
1 7 (16.67%) Analyst
2 6 (14.29%) Project Manager
3 5 (11.90%) Business Analyst
3 5 (11.90%) Developer
4 4 (9.52%) IT Manager
5 3 (7.14%) Lead
6 2 (4.76%) Applications Developer
6 2 (4.76%) Architect
6 2 (4.76%) Data Manager
6 2 (4.76%) IT Analyst
6 2 (4.76%) Mobile Applications Developer
6 2 (4.76%) Mobile Developer
6 2 (4.76%) Service Analyst
6 2 (4.76%) Service Desk Analyst
6 2 (4.76%) Solutions Architect
7 1 (2.38%) Change Management Consultant
7 1 (2.38%) Legal Analyst
7 1 (2.38%) Procurement Manager
7 1 (2.38%) Project Leader
7 1 (2.38%) Service Manager
Libraries, Frameworks & Software Standards
1 2 (4.76%) Django
2 1 (2.38%) Flutter
Miscellaneous
1 4 (9.52%) Onboarding
2 3 (7.14%) Management Information System
2 3 (7.14%) Market Risk
2 3 (7.14%) Mobile App
3 2 (4.76%) Self-Motivation
4 1 (2.38%) Data Centre
4 1 (2.38%) Derivative
4 1 (2.38%) Enterprise Storage
4 1 (2.38%) Foreign Exchange (FX)
4 1 (2.38%) Hackathon
4 1 (2.38%) Replication
Operating Systems
1 2 (4.76%) Windows
1 2 (4.76%) Windows 10
Processes & Methodologies
1 10 (23.81%) Project Management
2 8 (19.05%) Risk Management
3 7 (16.67%) Agile
3 7 (16.67%) Stakeholder Engagement
3 7 (16.67%) Stakeholder Management
4 5 (11.90%) Analytics
4 5 (11.90%) Business Analysis
5 4 (9.52%) Continuous Improvement
5 4 (9.52%) Contract Management
5 4 (9.52%) Problem-Solving
6 3 (7.14%) Business Analytics
6 3 (7.14%) Change Management
6 3 (7.14%) Contract Negotiation
6 3 (7.14%) Data Analysis
6 3 (7.14%) ERP
6 3 (7.14%) ITIL
6 3 (7.14%) Migration
6 3 (7.14%) Process Improvement
6 3 (7.14%) Project Delivery
6 3 (7.14%) Service Delivery
Programming Languages
1 5 (11.90%) Python
2 2 (4.76%) SQL
2 2 (4.76%) VBA
3 1 (2.38%) C#
3 1 (2.38%) Dart
3 1 (2.38%) Go
3 1 (2.38%) R
Qualifications
1 5 (11.90%) Degree
2 3 (7.14%) PMI Certification
2 3 (7.14%) PMP
3 2 (4.76%) ITIL Certification
4 1 (2.38%) CISA
4 1 (2.38%) ITIL Foundation Certificate
4 1 (2.38%) PRINCE2 Certification
4 1 (2.38%) TOGAF Certification
Quality Assurance & Compliance
1 4 (9.52%) Data Quality
2 2 (4.76%) GDPR
2 2 (4.76%) QA
3 1 (2.38%) COBIT
3 1 (2.38%) COSO
3 1 (2.38%) EMIR
3 1 (2.38%) MiFID
3 1 (2.38%) NIST
3 1 (2.38%) PMO
3 1 (2.38%) Sarbanes-Oxley
System Software
1 3 (7.14%) Active Directory
2 1 (2.38%) Virtual Servers
2 1 (2.38%) VMware Infrastructure
Systems Management
1 2 (4.76%) AirWatch
1 2 (4.76%) Microsoft Intune
1 2 (4.76%) Symantec Enterprise Vault
Vendors
1 5 (11.90%) Microsoft
2 3 (7.14%) Intapp
2 3 (7.14%) SAP
3 2 (4.76%) Aderant
3 2 (4.76%) Atlassian
3 2 (4.76%) iManage
3 2 (4.76%) Salesforce
3 2 (4.76%) ServiceNow
3 2 (4.76%) Symantec
4 1 (2.38%) Avaya
4 1 (2.38%) Bloomberg
4 1 (2.38%) Calypso
4 1 (2.38%) ESRI
4 1 (2.38%) Genesys
4 1 (2.38%) Google
4 1 (2.38%) LexisNexis
4 1 (2.38%) Marketo
4 1 (2.38%) Murex
4 1 (2.38%) Oracle
4 1 (2.38%) VMware