Microsoft Excel Contracts in the City of London

Microsoft Excel
Central London > City of London

The table below provides summary statistics for contract job vacancies advertised in the City of London requiring Microsoft Excel skills. It includes a benchmarking guide to the contractor rates offered in vacancies that cited Microsoft Excel over the 6 months leading up to 6 July 2025, comparing them to the same period in the previous two years.

6 months to
6 Jul 2025
Same period 2024 Same period 2023
Rank 37 66 55
Rank change year-on-year +29 -11 +27
Contract jobs citing Microsoft Excel 101 60 135
As % of all contract jobs advertised in the City of London 5.56% 2.81% 3.82%
As % of the Applications category 50.75% 44.44% 45.92%
Number of daily rates quoted 65 38 96
10th Percentile £252 £187 £273
25th Percentile £315 £327 £413
Median daily rate (50th Percentile) £433 £525 £550
Median % change year-on-year -17.62% -4.55% +10.00%
75th Percentile £675 £597 £687
90th Percentile £838 £691 £756
Central London median daily rate £425 £486 £550
% change year-on-year -12.55% -11.64% +10.00%
Number of hourly rates quoted 4 1 4
10th Percentile £14.05 - £12.83
25th Percentile £15.63 £19.92 £13.70
Median hourly rate £22.58 £20.61 £15.34
Median % change year-on-year +9.56% +34.32% -21.33%
75th Percentile £30.35 £21.29 £26.75
90th Percentile £32.95 - £42.95
Central London median hourly rate £28.15 £20.61 £15.34
% change year-on-year +36.62% +34.32% -21.33%

All Software Application Skills
City of London

Microsoft Excel falls under the Software Applications category. For comparison with the information above, the following table provides summary statistics for all contract job vacancies requiring software application skills in the City of London.

Contract vacancies with a requirement for software application skills 199 135 294
As % of all contract IT jobs advertised in the City of London 10.95% 6.33% 8.33%
Number of daily rates quoted 126 85 207
10th Percentile £256 £164 £199
25th Percentile £326 £255 £300
Median daily rate (50th Percentile) £475 £500 £500
Median % change year-on-year -5.00% - +3.09%
75th Percentile £625 £575 £638
90th Percentile £816 £685 £738
Central London median daily rate £475 £475 £480
% change year-on-year - -1.04% +9.03%
Number of hourly rates quoted 8 5 6
10th Percentile £15.45 - £13.22
25th Percentile £23.44 £12.75 £14.45
Median hourly rate £31.08 £20.61 £16.88
Median % change year-on-year +50.81% +22.10% -35.10%
75th Percentile £39.19 £27.00 £44.04
90th Percentile £51.15 - £53.25
Central London median hourly rate £29.07 £20.61 £16.88
% change year-on-year +41.08% +22.10% -35.10%

Microsoft Excel
Job Vacancy Trend in the City of London

Job postings citing Microsoft Excel as a proportion of all IT jobs advertised in the City of London.
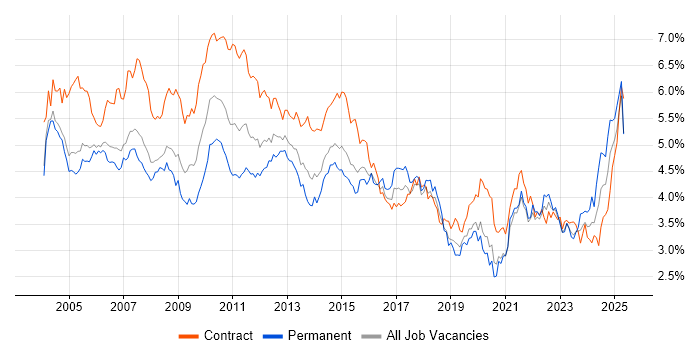
Job vacancy trend for Microsoft Excel in the City of London

Microsoft Excel
Contractor Daily Rate Trend in the City of London

3-month moving average daily rate quoted in jobs citing Microsoft Excel in the City of London.

Daily rate trend for Microsoft Excel in the City of London

Microsoft Excel
Daily Rate Histogram in the City of London

Daily rate distribution for jobs citing Microsoft Excel in the City of London over the 6 months to 6 July 2025.

Daily rate histogram for Microsoft Excel in the City of London

Microsoft Excel
Contractor Hourly Rate Trend in the City of London

3-month moving average hourly rates quoted in jobs citing Microsoft Excel in the City of London.

Hourly rate trend for Microsoft Excel in the City of London

Microsoft Excel
Hourly Rate Histogram in the City of London

Hourly rate distribution of jobs citing Microsoft Excel in the City of London over the 6 months to 6 July 2025.

Hourly rate histogram for Microsoft Excel in the City of London

Microsoft Excel
Co-occurring Skills and Capabilities in the City of London by Category

The follow tables expand on the table above by listing co-occurrences grouped by category. The same employment type, locality and period is covered with up to 20 co-occurrences shown in each of the following categories:

Application Platforms
1 9 (8.91%) SharePoint
2 8 (7.92%) Confluence
3 3 (2.97%) CMS
4 2 (1.98%) Apache Spark
4 2 (1.98%) Microsoft Exchange
4 2 (1.98%) Skype for Business
Applications
1 32 (31.68%) Microsoft PowerPoint
2 24 (23.76%) Microsoft Office
3 12 (11.88%) Microsoft Project
4 9 (8.91%) MS Visio
5 4 (3.96%) Spreadsheet
6 1 (0.99%) Adobe Creative Suite
6 1 (0.99%) Trello
Business Applications
1 2 (1.98%) Dynamics CRM
2 1 (0.99%) Dynamics GP
2 1 (0.99%) Maximo
2 1 (0.99%) Orchestrade
2 1 (0.99%) Workday HCM
Cloud Services
1 28 (27.72%) Power Platform
2 8 (7.92%) SaaS
3 7 (6.93%) Azure
4 6 (5.94%) Microsoft 365
5 4 (3.96%) GCP
6 2 (1.98%) Azure Data Factory
6 2 (1.98%) Azure DevOps
6 2 (1.98%) Dynamics 365
7 1 (0.99%) AWS
7 1 (0.99%) Cloud Functions
7 1 (0.99%) Collibra
7 1 (0.99%) Google Docs
7 1 (0.99%) Miro
7 1 (0.99%) Power Automate
7 1 (0.99%) Snowflake
Communications & Networking
1 3 (2.97%) LAN
2 2 (1.98%) Skype
2 2 (1.98%) Unified Communications
2 2 (1.98%) WebEx
3 1 (0.99%) DNS
3 1 (0.99%) Wireless
Database & Business Intelligence
1 28 (27.72%) Power BI
2 13 (12.87%) SQL Server
3 8 (7.92%) Data Mining
3 8 (7.92%) Tableau
4 7 (6.93%) Data Warehouse
5 5 (4.95%) SQL Server Reporting Services
6 4 (3.96%) BigQuery
7 2 (1.98%) Azure SQL Database
7 2 (1.98%) Big Data
7 2 (1.98%) Oracle Database
7 2 (1.98%) Parquet
7 2 (1.98%) Power Query
7 2 (1.98%) Relational Database
8 1 (0.99%) Apache Hive
8 1 (0.99%) BusinessObjects
8 1 (0.99%) Hadoop
8 1 (0.99%) MS Access
8 1 (0.99%) NoSQL
8 1 (0.99%) QlikView
8 1 (0.99%) RDBMS
Development Applications
1 12 (11.88%) JIRA
2 1 (0.99%) MSI
General
1 56 (55.45%) Finance
2 52 (51.49%) Social Skills
3 29 (28.71%) Banking
4 28 (27.72%) Analytical Skills
5 12 (11.88%) Investment Banking
6 8 (7.92%) Legal
7 7 (6.93%) Presentation Skills
8 6 (5.94%) Front Office
8 6 (5.94%) Organisational Skills
9 5 (4.95%) Documentation Skills
9 5 (4.95%) Financial Institution
9 5 (4.95%) Marketing
10 4 (3.96%) Billing
10 4 (3.96%) Inclusion and Diversity
10 4 (3.96%) Law
11 3 (2.97%) Back Office
11 3 (2.97%) Corporate Banking
12 2 (1.98%) Advertising
12 2 (1.98%) Retail
13 1 (0.99%) Military
Job Titles
1 38 (37.62%) Analyst
2 22 (21.78%) Data Analyst
3 13 (12.87%) Senior
4 11 (10.89%) Developer
5 10 (9.90%) Business Analyst
6 9 (8.91%) Project Manager
7 8 (7.92%) Consultant
8 7 (6.93%) Risk Consultant
8 7 (6.93%) Senior Consultant
9 5 (4.95%) Coordinator
10 4 (3.96%) Applications Developer
10 4 (3.96%) Automation Developer
10 4 (3.96%) Data Business Analyst
10 4 (3.96%) IT Analyst
10 4 (3.96%) Lead
11 3 (2.97%) Administrator
11 3 (2.97%) Report Analyst
11 3 (2.97%) Senior Analyst
11 3 (2.97%) Service Analyst
11 3 (2.97%) Support Specialist
Libraries, Frameworks & Software Standards
1 7 (6.93%) .NET
2 3 (2.97%) .NET Core
3 2 (1.98%) Apache Avro
4 1 (0.99%) ADO
4 1 (0.99%) Apache Beam
4 1 (0.99%) Bootstrap
4 1 (0.99%) CSS
4 1 (0.99%) DCOM
4 1 (0.99%) HTML
4 1 (0.99%) jQuery
4 1 (0.99%) Spring Boot
Miscellaneous
1 9 (8.91%) Market Risk
2 5 (4.95%) Management Information System
3 4 (3.96%) Foreign Exchange (FX)
3 4 (3.96%) Onboarding
3 4 (3.96%) Product Ownership
4 3 (2.97%) PMI
4 3 (2.97%) Reference Data
4 3 (2.97%) Reinsurance
4 3 (2.97%) Self-Motivation
5 2 (1.98%) Analytical Mindset
5 2 (1.98%) Credit Risk
5 2 (1.98%) Data Centre
5 2 (1.98%) Data Structures
5 2 (1.98%) Greenfield Project
5 2 (1.98%) Pricing Data
5 2 (1.98%) Video Conferencing
6 1 (0.99%) Biopharmaceutical
6 1 (0.99%) Cloud Native
6 1 (0.99%) Legacy Systems
6 1 (0.99%) Virtual Team
Operating Systems
1 7 (6.93%) Windows
2 3 (2.97%) Windows 10
3 1 (0.99%) Apple iOS
3 1 (0.99%) Unix
Processes & Methodologies
1 35 (34.65%) Problem-Solving
2 27 (26.73%) Business Intelligence
3 25 (24.75%) Agile
3 25 (24.75%) Project Management
4 23 (22.77%) Data Analysis
5 22 (21.78%) Analytics
6 16 (15.84%) Continuous Improvement
7 15 (14.85%) Data Management
8 14 (13.86%) Stakeholder Management
9 12 (11.88%) Data Modelling
9 12 (11.88%) SDLC
9 12 (11.88%) Visualisation
10 11 (10.89%) Scrum
11 10 (9.90%) Data Visualisation
11 10 (9.90%) Migration
11 10 (9.90%) Scenario Testing
12 9 (8.91%) Decision-Making
12 9 (8.91%) Service Delivery
12 9 (8.91%) Stakeholder Engagement
12 9 (8.91%) User Acceptance Testing
Programming Languages
1 40 (39.60%) SQL
2 11 (10.89%) Python
3 9 (8.91%) VBA
4 7 (6.93%) C#
5 2 (1.98%) Data Analysis Expressions
5 2 (1.98%) Java
5 2 (1.98%) R
6 1 (0.99%) JavaScript
6 1 (0.99%) PL/SQL
6 1 (0.99%) PowerShell
6 1 (0.99%) Scala
6 1 (0.99%) T-SQL
Qualifications
1 22 (21.78%) Degree
2 8 (7.92%) PMI Certification
3 5 (4.95%) PMP
4 2 (1.98%) CBAP
4 2 (1.98%) ITIL Certification
5 1 (0.99%) ACCA
5 1 (0.99%) CFA
5 1 (0.99%) Computer Science Degree
5 1 (0.99%) IIBA
5 1 (0.99%) Master's Degree
5 1 (0.99%) PRINCE2 Certification
5 1 (0.99%) SC Cleared
5 1 (0.99%) Security Cleared
Quality Assurance & Compliance
1 10 (9.90%) Data Quality
1 10 (9.90%) PMO
2 8 (7.92%) Basel II
3 5 (4.95%) QA
4 4 (3.96%) Accessibility
5 3 (2.97%) MiFID
6 2 (1.98%) GDPR
6 2 (1.98%) ISO/IEC 27001
7 1 (0.99%) Actionable Recommendations
7 1 (0.99%) COBIT
7 1 (0.99%) EMIR
7 1 (0.99%) GAAP
7 1 (0.99%) NIST
System Software
1 3 (2.97%) Active Directory
Systems Management
1 3 (2.97%) Terraform
2 2 (1.98%) AirWatch
2 2 (1.98%) Microsoft Intune
2 2 (1.98%) SCCM
2 2 (1.98%) Symantec Enterprise Vault
Vendors
1 38 (37.62%) Microsoft
2 9 (8.91%) Oracle
3 6 (5.94%) ServiceNow
4 5 (4.95%) Google
5 4 (3.96%) Salesforce
5 4 (3.96%) SAP
6 3 (2.97%) Symantec
7 2 (1.98%) Adobe
7 2 (1.98%) Alteryx
7 2 (1.98%) Arista
7 2 (1.98%) Cisco
7 2 (1.98%) Dell
7 2 (1.98%) HP
7 2 (1.98%) iManage
7 2 (1.98%) Intapp
7 2 (1.98%) Polycom
7 2 (1.98%) UiPath
8 1 (0.99%) dotdigital
8 1 (0.99%) Duck Creek
8 1 (0.99%) Workday