Microsoft 365 Contract Job Trends in the City of London

Microsoft 365 (M365, Office 365, O365)
Central London > City of London

The table below provides summary statistics and contractor rates for jobs advertised in the City of London requiring Microsoft 365 skills. It covers vacancies from the 6 months leading up to 16 September 2025, with comparisons to the same periods in the previous two years.

6 months to
16 Sep 2025
Same period 2024 Same period 2023
Rank 51 39 33
Rank change year-on-year -12 -6 +8
Contract jobs citing Microsoft 365 77 102 166
As % of all contract jobs advertised in the City of London 4.38% 4.93% 5.46%
As % of the Cloud Services category 10.88% 12.19% 13.11%
Number of daily rates quoted 38 59 117
10th Percentile £218 £184 £153
25th Percentile £322 £344 £206
Median daily rate (50th Percentile) £498 £525 £425
Median % change year-on-year -5.19% +23.53% +3.03%
75th Percentile £550 £573 £538
90th Percentile £641 £651 £610
Central London median daily rate £496 £488 £400
% change year-on-year +1.64% +21.88% +8.84%
Number of hourly rates quoted 3 2 1
10th Percentile £23.93 - -
25th Percentile £24.21 - £21.25
Median hourly rate £24.66 £27.00 £22.50
Median % change year-on-year -8.67% +20.00% +15.38%
75th Percentile £27.75 - £23.75
90th Percentile £29.25 - -
Central London median hourly rate £24.58 £27.00 £22.50
% change year-on-year -8.96% +20.00% +12.50%

All Cloud Skills
City of London

Microsoft 365 falls under the Cloud Services category. For comparison with the information above, the following table provides summary statistics for all contract job vacancies requiring cloud computing skills in the City of London.

Contract vacancies with a requirement for cloud computing skills 708 837 1,266
As % of all contract IT jobs advertised in the City of London 40.25% 40.45% 41.60%
Number of daily rates quoted 487 553 865
10th Percentile £337 £397 £325
25th Percentile £433 £475 £463
Median daily rate (50th Percentile) £550 £565 £575
Median % change year-on-year -2.65% -1.74% -
75th Percentile £668 £675 £688
90th Percentile £753 £775 £800
Central London median daily rate £550 £563 £563
% change year-on-year -2.22% - -2.17%
Number of hourly rates quoted 12 3 6
10th Percentile £23.84 - £14.63
25th Percentile £26.23 - £17.00
Median hourly rate £34.33 £27.00 £20.75
Median % change year-on-year +27.13% +30.12% -38.97%
75th Percentile £58.96 £59.75 £34.44
90th Percentile £86.43 £79.40 £45.25
Central London median hourly rate £34.00 £35.00 £20.75
% change year-on-year -2.86% +68.67% -37.59%

Microsoft 365
Job Vacancy Trend in the City of London

Job postings citing Microsoft 365 as a proportion of all IT jobs advertised in the City of London.
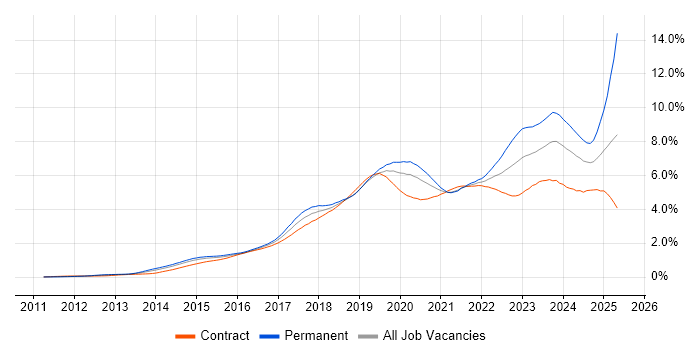
Job vacancy trend for Microsoft 365 in the City of London

Microsoft 365
Daily Rate Trend in the City of London

Contractor daily rate distribution trend for jobs in the City of London citing Microsoft 365.

Contractor daily rate distribution trend for jobs in the City of London citing Microsoft 365

Microsoft 365
Daily Rate Histogram in the City of London

Daily rate distribution for jobs citing Microsoft 365 in the City of London over the 6 months to 16 September 2025.

Daily rate histogram for Microsoft 365 in the City of London

Microsoft 365
Hourly Rate Trend in the City of London

Contractor hourly rate distribution trend for jobs in the City of London citing Microsoft 365.

Contractor hourly rate distribution trend for jobs in the City of London citing Microsoft 365

Microsoft 365
Contract Job Locations in the City of London

The table below looks at the demand and provides a guide to the median contractor rates quoted in IT jobs citing Microsoft 365 within the City of London region over the 6 months to 16 September 2025. The 'Rank Change' column provides an indication of the change in demand within each location based on the same 6 month period last year.

Location Rank Change
on Same Period
Last Year
Matching
Contract
IT Job Ads
Median
Daily Rate
Past 6 Months
Median Daily Rate
% Change
on Same Period
Last Year
Live
Jobs
London Bridge - 2 - -
Microsoft 365
Central London

Microsoft 365
Co-occurring Skills and Capabilities in the City of London by Category

The follow tables expand on the table above by listing co-occurrences grouped by category. The same employment type, locality and period is covered with up to 20 co-occurrences shown in each of the following categories:

Application Platforms
1 29 (37.66%) SharePoint
2 11 (14.29%) Microsoft Exchange
3 2 (2.60%) Confluence
Applications
1 8 (10.39%) Microsoft Office
2 7 (9.09%) Microsoft Excel
3 2 (2.60%) Microsoft PowerPoint
4 1 (1.30%) Microsoft Project
4 1 (1.30%) MS Visio
Business Applications
1 4 (5.19%) Salesforce CRM
2 3 (3.90%) Remedy ITSM
2 3 (3.90%) Workday HCM
3 2 (2.60%) Dynamics CRM
Cloud Services
1 47 (61.04%) Azure
2 20 (25.97%) Power Platform
3 19 (24.68%) Entra ID
4 13 (16.88%) Power Automate
5 11 (14.29%) PowerApps
6 7 (9.09%) Azure DevOps
6 7 (9.09%) OneDrive
6 7 (9.09%) PaaS
7 5 (6.49%) AWS
7 5 (6.49%) IaaS
8 4 (5.19%) Azure AKS
8 4 (5.19%) Azure Data Factory
8 4 (5.19%) Cloud Computing
8 4 (5.19%) Microsoft Copilot
8 4 (5.19%) SaaS
8 4 (5.19%) ShareGate
9 3 (3.90%) Asana
10 2 (2.60%) Copilot Studio
10 2 (2.60%) Dynamics 365
10 2 (2.60%) GitHub
Communications & Networking
1 9 (11.69%) Firewall
2 6 (7.79%) DNS
3 5 (6.49%) Wi-Fi
4 4 (5.19%) DHCP
4 4 (5.19%) LAN
4 4 (5.19%) TCP/IP
4 4 (5.19%) WAN
5 2 (2.60%) Intranet
5 2 (2.60%) SAN
5 2 (2.60%) Softphone
5 2 (2.60%) VPN
5 2 (2.60%) Wireless
6 1 (1.30%) Internet
6 1 (1.30%) IP Telephony
6 1 (1.30%) MPLS
6 1 (1.30%) NetScaler
6 1 (1.30%) Network Security
Database & Business Intelligence
1 11 (14.29%) Power BI
2 4 (5.19%) SQL Server
3 2 (2.60%) BusinessObjects
3 2 (2.60%) Crystal Reports
3 2 (2.60%) Data Warehouse
3 2 (2.60%) SQL Server Integration Services
3 2 (2.60%) Tableau
4 1 (1.30%) Azure SQL Database
Development Applications
1 5 (6.49%) JIRA
General
1 28 (36.36%) Finance
2 23 (29.87%) Social Skills
3 8 (10.39%) Banking
4 6 (7.79%) Inclusion and Diversity
5 5 (6.49%) Analytical Skills
5 5 (6.49%) Presentation Skills
6 3 (3.90%) Documentation Skills
6 3 (3.90%) Law
7 2 (2.60%) Telecoms
8 1 (1.30%) Automotive
8 1 (1.30%) Billing
8 1 (1.30%) Financial Institution
8 1 (1.30%) International Banking
8 1 (1.30%) Investment Banking
8 1 (1.30%) Legal
8 1 (1.30%) Marketing
8 1 (1.30%) Military
8 1 (1.30%) Public Sector
8 1 (1.30%) Retail
Job Titles
1 10 (12.99%) Architect
2 9 (11.69%) Support Engineer
3 8 (10.39%) IT Support
4 7 (9.09%) Analyst
4 7 (9.09%) Lead
5 6 (7.79%) Desktop Support
5 6 (7.79%) Solutions Architect
6 5 (6.49%) 2nd Line Support
6 5 (6.49%) Consultant
6 5 (6.49%) Developer
6 5 (6.49%) Infrastructure Engineer
7 4 (5.19%) Desktop Engineer
7 4 (5.19%) Desktop Support Engineer
7 4 (5.19%) IT Engineer
7 4 (5.19%) Project Manager
7 4 (5.19%) Support Analyst
7 4 (5.19%) Technical Architect
8 3 (3.90%) Coordinator
8 3 (3.90%) Microsoft Engineer
8 3 (3.90%) Support Assistant
Libraries, Frameworks & Software Standards
1 6 (7.79%) Microsoft Graph
2 4 (5.19%) .NET
3 3 (3.90%) Lightning Web Components
3 3 (3.90%) RESTful
3 3 (3.90%) Web Services
4 1 (1.30%) .NET Core
4 1 (1.30%) ADO
4 1 (1.30%) ARM Templates
4 1 (1.30%) LangChain
4 1 (1.30%) Semantic Kernel
4 1 (1.30%) SPFx
Miscellaneous
1 4 (5.19%) iPad
1 4 (5.19%) Video Conferencing
2 3 (3.90%) Data Centre
3 2 (2.60%) Analytical Mindset
3 2 (2.60%) iPhone
3 2 (2.60%) Low-Code
3 2 (2.60%) Onboarding
4 1 (1.30%) AI Agents
4 1 (1.30%) CCTV
4 1 (1.30%) CMDB
4 1 (1.30%) Data Structures
4 1 (1.30%) Fat Client
4 1 (1.30%) Hedge funds
4 1 (1.30%) Hybrid Cloud
4 1 (1.30%) Management Information System
4 1 (1.30%) Mobile App
4 1 (1.30%) Private Cloud
4 1 (1.30%) Product Ownership
4 1 (1.30%) Smartphone
4 1 (1.30%) Thin Client
Operating Systems
1 27 (35.06%) Windows
2 9 (11.69%) Windows Server
3 6 (7.79%) Windows 10
4 3 (3.90%) Mac OS
5 2 (2.60%) Apple iOS
5 2 (2.60%) Linux
6 1 (1.30%) Mac OS X
6 1 (1.30%) Windows 7
Processes & Methodologies
1 23 (29.87%) ITIL
2 15 (19.48%) Problem-Solving
3 13 (16.88%) Migration
4 12 (15.58%) Business Intelligence
4 12 (15.58%) ITSM
5 11 (14.29%) Roadmaps
5 11 (14.29%) Service Management
6 10 (12.99%) Data Loss Prevention
7 9 (11.69%) Agile
8 8 (10.39%) DevOps
8 8 (10.39%) Stakeholder Management
9 7 (9.09%) Cybersecurity
9 7 (9.09%) Technical Leadership
9 7 (9.09%) User Experience
10 6 (7.79%) CRM
10 6 (7.79%) Customer Service
10 6 (7.79%) Infrastructure Engineering
11 5 (6.49%) Asset Management
11 5 (6.49%) Change Management
11 5 (6.49%) Project Delivery
Programming Languages
1 15 (19.48%) PowerShell
2 4 (5.19%) Python
3 3 (3.90%) C#
3 3 (3.90%) SQL
4 2 (2.60%) Bicep
5 1 (1.30%) Bash
5 1 (1.30%) JavaScript
5 1 (1.30%) Perl
Qualifications
1 13 (16.88%) Degree
2 12 (15.58%) Microsoft Certification
3 9 (11.69%) SC Cleared
3 9 (11.69%) Security Cleared
4 4 (5.19%) Azure Certification
5 3 (3.90%) ITIL Certification
6 2 (2.60%) CCNA
6 2 (2.60%) Cisco Certification
6 2 (2.60%) DV Cleared
6 2 (2.60%) ITIL Foundation Certificate
6 2 (2.60%) MCITP
6 2 (2.60%) MCSA
6 2 (2.60%) MCSE
7 1 (1.30%) Computer Science Degree
7 1 (1.30%) CSPO
7 1 (1.30%) MOS
7 1 (1.30%) PMI Certification
7 1 (1.30%) PMP
7 1 (1.30%) PRINCE2 Certification
Quality Assurance & Compliance
1 5 (6.49%) GDPR
2 3 (3.90%) COBIT
2 3 (3.90%) ISO/IEC 27001
2 3 (3.90%) SLA
3 2 (2.60%) NIST
4 1 (1.30%) Cyber Essentials
4 1 (1.30%) EU AI Act
4 1 (1.30%) HIPAA
4 1 (1.30%) ISO/IEC 42001
4 1 (1.30%) PMO
System Software
1 29 (37.66%) Active Directory
2 2 (2.60%) Hyper-V
2 2 (2.60%) Microsoft App-V
2 2 (2.60%) Virtual Desktop
2 2 (2.60%) VMware Infrastructure
3 1 (1.30%) Virtual Machines
Systems Management
1 18 (23.38%) Microsoft Intune
2 8 (10.39%) SCCM
3 3 (3.90%) Terraform
4 2 (2.60%) Kubernetes
4 2 (2.60%) SCOM
5 1 (1.30%) AirWatch
5 1 (1.30%) Grafana
5 1 (1.30%) HP ALM
5 1 (1.30%) Istio
5 1 (1.30%) Prometheus
5 1 (1.30%) QRadar
5 1 (1.30%) Single Sign-On
Vendors
1 57 (74.03%) Microsoft
2 10 (12.99%) ServiceNow
3 6 (7.79%) Citrix
3 6 (7.79%) Salesforce
4 3 (3.90%) Cisco
4 3 (3.90%) Databricks
4 3 (3.90%) HP
4 3 (3.90%) Oracle
4 3 (3.90%) Polycom
4 3 (3.90%) Remedy
4 3 (3.90%) VMware
4 3 (3.90%) Workday
5 2 (2.60%) Adobe
5 2 (2.60%) Apple
5 2 (2.60%) Meraki
5 2 (2.60%) OpenAI
5 2 (2.60%) Wyse
6 1 (1.30%) Avaya
6 1 (1.30%) Reuters
6 1 (1.30%) Sophos