SAML Contracts in the City of London

Security Assertion Markup Language (SAML)
Central London > City of London

The following table provides summary statistics for contract job vacancies advertised in the City of London with a requirement for SAML skills. Included is a benchmarking guide to the contractor rates offered in vacancies that have cited SAML over the 6 months to 25 April 2024 with a comparison to the same period in the previous 2 years.

6 months to
25 Apr 2024
Same period 2023 Same period 2022
Rank 108 158 183
Rank change year-on-year +50 +25 -39
Contract jobs citing SAML 21 14 10
As % of all contract jobs advertised in the City of London 0.95% 0.38% 0.24%
As % of the Libraries, Frameworks & Software Standards category 4.34% 1.33% 0.77%
Number of daily rates quoted 11 9 9
10th Percentile £313 £384 £473
25th Percentile £363 £513 £475
Median daily rate (50th Percentile) £525 £550 £500
Median % change year-on-year -4.55% +10.00% -23.08%
75th Percentile £706 £875 £625
90th Percentile £890 - £645
Central London median daily rate £525 £550 £500
% change year-on-year -4.55% +10.00% -23.08%

All Software Libraries and Frameworks
City of London

SAML is in the Software Libraries and Frameworks category. The following table is for comparison with the above and provides summary statistics for all contract job vacancies advertised in the City of London with a requirement for technical specification, industry standards, software libraries and framework skills.

Contract vacancies with a requirement for technical specification, industry standards, software libraries and framework skills 484 1,050 1,294
As % of all contract IT jobs advertised in the City of London 21.78% 28.80% 30.63%
Number of daily rates quoted 346 677 1,042
10th Percentile £403 £425 £425
25th Percentile £463 £506 £507
Median daily rate (50th Percentile) £565 £625 £600
Median % change year-on-year -9.60% +4.17% +9.09%
75th Percentile £688 £738 £713
90th Percentile £781 £825 £800
Central London median daily rate £551 £625 £600
% change year-on-year -11.92% +4.17% +9.09%
Number of hourly rates quoted 0 1 1
10th Percentile - - -
25th Percentile - £58.25 £46.25
Median hourly rate - £59.50 £47.50
Median % change year-on-year - +25.26% +171.43%
75th Percentile - £60.75 £48.75
90th Percentile - - -
Central London median hourly rate - £59.50 £47.50
% change year-on-year - +25.26% +171.43%

SAML
Job Vacancy Trend in the City of London

Job postings citing SAML as a proportion of all IT jobs advertised in the City of London.
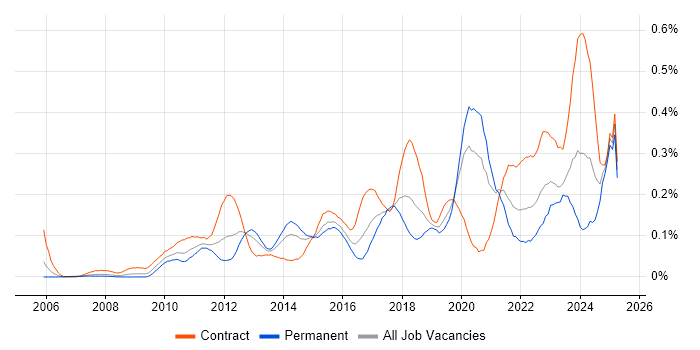
Job vacancy trend for SAML in the City of London

SAML
Contractor Daily Rate Trend in the City of London

3-month moving average daily rate quoted in jobs citing SAML in the City of London.

Daily rate trend for SAML in the City of London

SAML
Daily Rate Histogram in the City of London

Daily rate distribution for jobs citing SAML in the City of London over the 6 months to 25 April 2024.

Daily rate histogram for SAML in the City of London

SAML
Co-occurring Skills and Capabilities in the City of London by Category

The follow tables expand on the table above by listing co-occurrences grouped by category. The same employment type, locality and period is covered with up to 20 co-occurrences shown in each of the following categories:

Cloud Services
1 9 (42.86%) Azure
2 4 (19.05%) AWS
2 4 (19.05%) Entra ID
2 4 (19.05%) GCP
3 1 (4.76%) AWS CloudFormation
3 1 (4.76%) AWS Lambda
3 1 (4.76%) Azure Functions
3 1 (4.76%) GitHub
3 1 (4.76%) GitHub Actions
3 1 (4.76%) Microsoft 365
3 1 (4.76%) SaaS
3 1 (4.76%) Serverless
Communications & Networking
1 4 (19.05%) NetScaler
2 2 (9.52%) Firewall
3 1 (4.76%) DNS
3 1 (4.76%) Kerberos
3 1 (4.76%) Network Security
3 1 (4.76%) VPN
Database & Business Intelligence
1 1 (4.76%) NoSQL
1 1 (4.76%) SQL Server
Development Applications
1 3 (14.29%) Jenkins
2 1 (4.76%) Git
2 1 (4.76%) Gradle
2 1 (4.76%) Maven
2 1 (4.76%) Mockito
2 1 (4.76%) Sonatype Nexus
General
1 8 (38.10%) Finance
2 6 (28.57%) Social Skills
3 5 (23.81%) Public Sector
4 2 (9.52%) Banking
Job Titles
1 11 (52.38%) Architect
2 6 (28.57%) Security Architect
3 4 (19.05%) Developer
4 3 (14.29%) Java Developer
5 1 (4.76%) Analyst
5 1 (4.76%) Cloud Engineer
5 1 (4.76%) Consultant
5 1 (4.76%) Front-End Developer (Client-Side Developer)
5 1 (4.76%) IAM Consultant
5 1 (4.76%) Infrastructure Engineer
5 1 (4.76%) Support Analyst
Libraries, Frameworks & Software Standards
1 10 (47.62%) OpenID
2 6 (28.57%) XACML
3 4 (19.05%) OAuth
4 3 (14.29%) REST
4 3 (14.29%) Spring
4 3 (14.29%) Spring Boot
5 2 (9.52%) GWT
5 2 (9.52%) JAX-RS
5 2 (9.52%) LDAP
5 2 (9.52%) Restlet
6 1 (4.76%) AngularJS
6 1 (4.76%) Kafka
6 1 (4.76%) Middleware
6 1 (4.76%) OAuth2
6 1 (4.76%) RabbitMQ
6 1 (4.76%) RESTful
6 1 (4.76%) SailPoint
6 1 (4.76%) Tailwind CSS
Miscellaneous
1 1 (4.76%) Clustering
1 1 (4.76%) Distributed Systems
1 1 (4.76%) Hybrid Cloud
1 1 (4.76%) PKI
1 1 (4.76%) Public Cloud
1 1 (4.76%) Video Conferencing
1 1 (4.76%) Virtual Team
Operating Systems
1 1 (4.76%) Windows
Processes & Methodologies
1 6 (28.57%) Security Architecture
2 4 (19.05%) Build Automation
2 4 (19.05%) Identity Access Management
2 4 (19.05%) User Acceptance Testing
3 3 (14.29%) DevOps
3 3 (14.29%) Infrastructure Automation
3 3 (14.29%) User Experience
4 2 (9.52%) Identity Management
4 2 (9.52%) Roadmaps
4 2 (9.52%) UX Design
5 1 (4.76%) Architectural Design
5 1 (4.76%) Architectural Patterns
5 1 (4.76%) Design Patterns
5 1 (4.76%) Digital Identity
5 1 (4.76%) Event-Driven
5 1 (4.76%) Functional Programming
5 1 (4.76%) Kalman Filter
5 1 (4.76%) RBAC
5 1 (4.76%) Secrets Management
5 1 (4.76%) Technology Roadmap
Programming Languages
1 7 (33.33%) Python
2 3 (14.29%) Java
3 2 (9.52%) PowerShell
4 1 (4.76%) Go
4 1 (4.76%) JavaScript
4 1 (4.76%) TypeScript
Qualifications
1 8 (38.10%) SC Cleared
1 8 (38.10%) Security Cleared
Quality Assurance & Compliance
1 1 (4.76%) QA
1 1 (4.76%) WCAG
System Software
1 5 (23.81%) Active Directory
2 1 (4.76%) Docker
2 1 (4.76%) Firmware
2 1 (4.76%) VMware Infrastructure
Systems Management
1 12 (57.14%) Single Sign-On
2 6 (28.57%) Ansible
3 2 (9.52%) Active Directory Federation Services
3 2 (9.52%) Kubernetes
3 2 (9.52%) Terraform
4 1 (4.76%) Consul
4 1 (4.76%) Microsoft Clustering
4 1 (4.76%) PingFederate
4 1 (4.76%) SCCM
Vendors
1 7 (33.33%) Okta
2 5 (23.81%) IBM
3 4 (19.05%) Citrix
4 3 (14.29%) Google
4 3 (14.29%) Microsoft
5 1 (4.76%) CyberArk
5 1 (4.76%) ForgeRock
5 1 (4.76%) Ping Identity
5 1 (4.76%) Remedy
5 1 (4.76%) ServiceNow
5 1 (4.76%) VMware