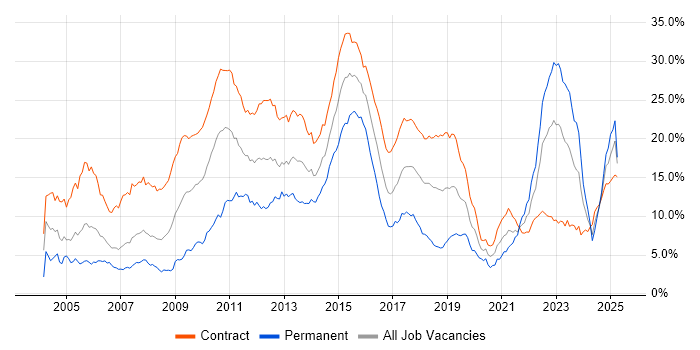
Banking Contracts in Edinburgh

Banking
Scotland > Edinburgh

The table below looks at the prevalence of the term Banking in contract job vacancies in Edinburgh. Included is a benchmarking guide to the contractor rates offered in vacancies that cited Banking over the 6 months leading up to 1 May 2025, comparing them to the same period in the previous two years.

6 months to
1 May 2025
Same period 2024 Same period 2023
Rank 8 20 21
Rank change year-on-year +12 +1 -1
Contract jobs citing Banking 93 61 124
As % of all contract jobs advertised in Edinburgh 14.88% 7.48% 9.52%
As % of the General category 19.29% 10.00% 13.14%
Number of daily rates quoted 22 24 52
10th Percentile £227 £457 £401
25th Percentile £466 £509 £455
Median daily rate (50th Percentile) £525 £575 £500
Median % change year-on-year -8.70% +15.00% -4.76%
75th Percentile £620 £654 £613
90th Percentile £724 £750 £775
Scotland median daily rate £479 £575 £513
% change year-on-year -16.70% +12.20% -2.38%

All General Skills
Edinburgh

Banking falls under the General Skills category. For comparison with the information above, the following table provides summary statistics for all contract job vacancies requiring common skills in Edinburgh.

Contract vacancies with a requirement for common skills 482 610 944
As % of all contract IT jobs advertised in Edinburgh 77.12% 74.85% 72.45%
Number of daily rates quoted 267 348 688
10th Percentile £199 £183 £250
25th Percentile £400 £400 £409
Median daily rate (50th Percentile) £475 £475 £475
75th Percentile £538 £575 £550
90th Percentile £627 £675 £625
Scotland median daily rate £465 £475 £475
% change year-on-year -2.21% - +3.83%
Number of hourly rates quoted 16 34 7
10th Percentile £19.77 £16.25 £14.83
25th Percentile £21.00 £16.50 £17.72
Median hourly rate £23.50 £35.00 £21.26
Median % change year-on-year -32.86% +64.63% -46.85%
75th Percentile £29.86 £60.75 £31.34
90th Percentile £52.90 £67.23 £51.60
Scotland median hourly rate £22.44 £19.17 £19.88
% change year-on-year +17.04% -3.57% -23.54%

Banking
Job Vacancy Trend in Edinburgh

Job postings citing Banking as a proportion of all IT jobs advertised in Edinburgh.

Job vacancy trend for Banking in Edinburgh

Banking
Contractor Daily Rate Trend in Edinburgh

3-month moving average daily rate quoted in jobs citing Banking in Edinburgh.

Daily rate trend for Banking in Edinburgh

Banking
Daily Rate Histogram in Edinburgh

Daily rate distribution for jobs citing Banking in Edinburgh over the 6 months to 1 May 2025.

Daily rate histogram for Banking in Edinburgh

Banking
Contractor Hourly Rate Trend in Edinburgh

3-month moving average hourly rates quoted in jobs citing Banking in Edinburgh.

Hourly rate trend for Banking in Edinburgh

Banking
Co-occurring Skills and Capabilities in Edinburgh by Category

The follow tables expand on the table above by listing co-occurrences grouped by category. The same employment type, locality and period is covered with up to 20 co-occurrences shown in each of the following categories:

Application Platforms
1 7 (7.53%) Confluence
2 5 (5.38%) Apache Airflow
3 3 (3.23%) SharePoint
4 2 (2.15%) Camunda
5 1 (1.08%) Adobe Experience Manager
5 1 (1.08%) Apache Spark
5 1 (1.08%) SAS
Applications
1 5 (5.38%) Microsoft Excel
1 5 (5.38%) Microsoft Office
2 4 (4.30%) Microsoft PowerPoint
3 3 (3.23%) MS Visio
Business Applications
1 1 (1.08%) Oracle Applications
Cloud Services
1 10 (10.75%) AWS
2 6 (6.45%) Azure
2 6 (6.45%) Power Platform
3 5 (5.38%) GCP
3 5 (5.38%) Snowflake
4 4 (4.30%) Apigee
5 3 (3.23%) Amazon EKS
6 2 (2.15%) Amazon S3
6 2 (2.15%) IaaS
7 1 (1.08%) Amazon EC2
7 1 (1.08%) Amazon EMR
7 1 (1.08%) Azure Data Factory
7 1 (1.08%) Azure Sentinel
7 1 (1.08%) Azure Synapse Analytics
7 1 (1.08%) Cloud Computing
7 1 (1.08%) Cloud Run
7 1 (1.08%) GitHub
7 1 (1.08%) PaaS
7 1 (1.08%) SaaS
7 1 (1.08%) Serverless
Communications & Networking
1 2 (2.15%) TCP/IP
2 1 (1.08%) ATM
2 1 (1.08%) DNS
2 1 (1.08%) HTTP
2 1 (1.08%) Network Security
2 1 (1.08%) SNA
2 1 (1.08%) SSL
Database & Business Intelligence
1 7 (7.53%) Data Warehouse
2 6 (6.45%) Power BI
2 6 (6.45%) Tableau
3 4 (4.30%) PostgreSQL
4 3 (3.23%) MongoDB
5 2 (2.15%) Amazon Athena
5 2 (2.15%) Apache Hive
5 2 (2.15%) Data Lake
5 2 (2.15%) Elasticsearch
5 2 (2.15%) Hadoop
6 1 (1.08%) Amazon RDS
6 1 (1.08%) Azure SQL Database
6 1 (1.08%) Metadata
6 1 (1.08%) MS Access
6 1 (1.08%) PowerCenter
6 1 (1.08%) QlikView
6 1 (1.08%) SQL Server
Development Applications
1 11 (11.83%) JIRA
2 6 (6.45%) GitLab
3 4 (4.30%) Git
3 4 (4.30%) Selenium
4 2 (2.15%) Artifactory
4 2 (2.15%) Bitbucket
4 2 (2.15%) Bitbucket Server
4 2 (2.15%) Jenkins
5 1 (1.08%) Cypress.io
5 1 (1.08%) HP UFT
5 1 (1.08%) JMeter
5 1 (1.08%) JUnit
5 1 (1.08%) LoadRunner
5 1 (1.08%) Postman
5 1 (1.08%) REST Assured
5 1 (1.08%) TeamCity
5 1 (1.08%) Zephyr
General
1 57 (61.29%) Finance
2 23 (24.73%) Social Skills
3 19 (20.43%) Retail Banking
4 16 (17.20%) Analytical Skills
5 8 (8.60%) Retail
6 6 (6.45%) Investment Banking
7 5 (5.38%) Corporate Banking
8 3 (3.23%) Financial Institution
9 2 (2.15%) Organisational Skills
10 1 (1.08%) Front Office
Job Titles
1 21 (22.58%) Analyst
2 11 (11.83%) Architect
3 9 (9.68%) Business Analyst
3 9 (9.68%) Technical Analyst
4 8 (8.60%) Developer
4 8 (8.60%) Lead
5 5 (5.38%) Data Analyst
5 5 (5.38%) Data Engineer
5 5 (5.38%) Project Manager
5 5 (5.38%) Senior
5 5 (5.38%) Technical Business Analyst
5 5 (5.38%) Technical Manager
6 4 (4.30%) Consultant
6 4 (4.30%) Solutions Architect
6 4 (4.30%) Tester
7 3 (3.23%) Delivery Manager
7 3 (3.23%) Infrastructure Architect
7 3 (3.23%) Performance Manager
7 3 (3.23%) Security Specialist
7 3 (3.23%) Test Analyst
Libraries, Frameworks & Software Standards
1 4 (4.30%) Middleware
1 4 (4.30%) RESTful
1 4 (4.30%) Spring
1 4 (4.30%) Spring Boot
2 3 (3.23%) Swagger
3 2 (2.15%) LDAP
3 2 (2.15%) OpenAPI
3 2 (2.15%) Spring Security
3 2 (2.15%) XML
4 1 (1.08%) Kafka
4 1 (1.08%) OAuth
4 1 (1.08%) OpenID
4 1 (1.08%) Playwright
4 1 (1.08%) PySpark
Miscellaneous
1 6 (6.45%) Data Protection Act
2 5 (5.38%) Legacy Systems
2 5 (5.38%) Mainframe
3 4 (4.30%) CMDB
3 4 (4.30%) Data Centre
4 3 (3.23%) Clustering
4 3 (3.23%) SWIFT Messaging Network
5 2 (2.15%) Distributed Architecture
5 2 (2.15%) FMCG
5 2 (2.15%) Hybrid Cloud
5 2 (2.15%) Mobile App
5 2 (2.15%) Onboarding
6 1 (1.08%) Greenfield Project
6 1 (1.08%) IBM Mainframe
6 1 (1.08%) Private Cloud
6 1 (1.08%) Product Ownership
6 1 (1.08%) Public Cloud
6 1 (1.08%) Security Operations Centre
6 1 (1.08%) Self-Motivation
6 1 (1.08%) Team-Oriented Environment
Operating Systems
1 6 (6.45%) Windows
2 5 (5.38%) Unix
3 3 (3.23%) Linux
4 2 (2.15%) AIX
4 2 (2.15%) Red Hat Enterprise Linux
4 2 (2.15%) zOS
5 1 (1.08%) HPUX
5 1 (1.08%) Oracle Linux
5 1 (1.08%) Solaris
Processes & Methodologies
1 25 (26.88%) Agile
2 19 (20.43%) Migration
2 19 (20.43%) Problem-Solving
3 12 (12.90%) Risk Management
3 12 (12.90%) Stakeholder Management
4 11 (11.83%) Data Analysis
4 11 (11.83%) Decision-Making
4 11 (11.83%) Test Automation
5 10 (10.75%) CI/CD
6 9 (9.68%) DevOps
7 8 (8.60%) Business Analysis
7 8 (8.60%) Business Intelligence
7 8 (8.60%) Data Modelling
8 7 (7.53%) Analytics
8 7 (7.53%) Dashboard Development
8 7 (7.53%) Data Migration
8 7 (7.53%) Visualisation
9 6 (6.45%) Containerisation
9 6 (6.45%) Data Engineering
9 6 (6.45%) Project Delivery
Programming Languages
1 17 (18.28%) SQL
2 8 (8.60%) Python
3 5 (5.38%) PL/SQL
4 4 (4.30%) Java
5 1 (1.08%) Bash
5 1 (1.08%) Groovy
5 1 (1.08%) JCL
5 1 (1.08%) Perl
5 1 (1.08%) PowerShell
5 1 (1.08%) Shell Script
5 1 (1.08%) T-SQL
5 1 (1.08%) VBA
Qualifications
1 4 (4.30%) CISSP
2 3 (3.23%) Azure Certification
2 3 (3.23%) CEH
2 3 (3.23%) Degree
2 3 (3.23%) OSCP
3 2 (2.15%) CRISC
3 2 (2.15%) GCIH
4 1 (1.08%) (ISC)2 CCSP
4 1 (1.08%) ACCA
4 1 (1.08%) AWS Certification
4 1 (1.08%) AWS Certified Solutions Architect
4 1 (1.08%) CCSP
4 1 (1.08%) CISA
4 1 (1.08%) Cisco Certification
4 1 (1.08%) CISM
4 1 (1.08%) GCFA
4 1 (1.08%) ITIL Certification
4 1 (1.08%) Microsoft Certification
4 1 (1.08%) TOGAF Certification
Quality Assurance & Compliance
1 4 (4.30%) Sarbanes-Oxley
2 3 (3.23%) QA
3 2 (2.15%) Disclosure Scotland
3 2 (2.15%) ISO 20022
3 2 (2.15%) PCI DSS
4 1 (1.08%) Basel III
4 1 (1.08%) COBIT
4 1 (1.08%) Data Quality
4 1 (1.08%) GDPR
4 1 (1.08%) NIST
4 1 (1.08%) PMO
4 1 (1.08%) SLA
System Software
1 4 (4.30%) Docker
2 2 (2.15%) Hyper-V
2 2 (2.15%) VMware Infrastructure
3 1 (1.08%) Virtual Machines
Systems Management
1 4 (4.30%) Kubernetes
2 3 (3.23%) Ansible
3 2 (2.15%) Single Sign-On
3 2 (2.15%) Terraform
4 1 (1.08%) Grafana
4 1 (1.08%) Progress Chef
4 1 (1.08%) Puppet
4 1 (1.08%) Tivoli NetView
Vendors
1 10 (10.75%) Microsoft
2 8 (8.60%) Splunk
3 6 (6.45%) IBM
4 5 (5.38%) Oracle
5 4 (4.30%) Informatica
6 3 (3.23%) Google
7 2 (2.15%) CyberArk
7 2 (2.15%) ServiceNow
7 2 (2.15%) StreamSets
7 2 (2.15%) Teradata
7 2 (2.15%) VMware
8 1 (1.08%) Alteryx
8 1 (1.08%) Avaloq
8 1 (1.08%) Confluent
8 1 (1.08%) CrowdStrike
8 1 (1.08%) Databricks
8 1 (1.08%) Dynatrace
8 1 (1.08%) Fiserv
8 1 (1.08%) Planview
8 1 (1.08%) Qualys