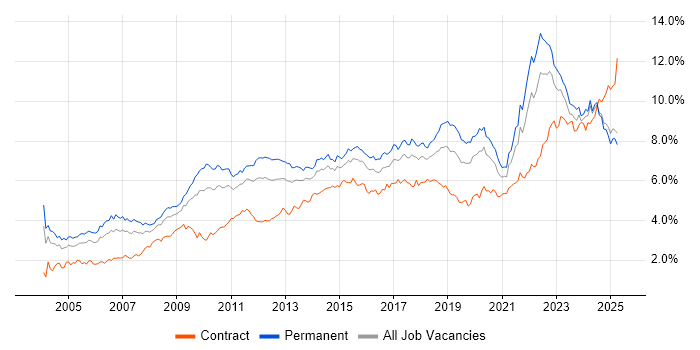
Analytical Skills Contracts in the Midlands

Analytical Skills
England > Midlands

The table below looks at the prevalence of the term Analytical Skills in contract job vacancies in the Midlands. Included is a benchmarking guide to the contractor rates offered in vacancies that cited Analytical Skills over the 6 months leading up to 11 June 2025, comparing them to the same period in the previous two years.

6 months to
11 Jun 2025
Same period 2024 Same period 2023
Rank 10 12 14
Rank change year-on-year +2 +2 +14
Contract jobs citing Analytical Skills 254 252 308
As % of all contract jobs advertised in the Midlands 11.88% 8.64% 9.56%
As % of the General category 19.00% 16.09% 17.44%
Number of daily rates quoted 149 176 202
10th Percentile £168 £309 £231
25th Percentile £308 £413 £370
Median daily rate (50th Percentile) £425 £525 £475
Median % change year-on-year -19.05% +10.53% +5.56%
75th Percentile £541 £650 £550
90th Percentile £638 £813 £664
England median daily rate £525 £525 £530
% change year-on-year - -0.94% -
Number of hourly rates quoted 20 23 5
10th Percentile £15.12 £11.83 £19.63
25th Percentile £24.81 £12.75 £20.49
Median hourly rate £34.43 £14.00 £23.50
Median % change year-on-year +145.93% -40.43% +46.88%
75th Percentile £50.00 £16.46 £25.88
90th Percentile - £26.98 £40.35
England median hourly rate £32.50 £19.50 £43.86
% change year-on-year +66.67% -55.54% +35.37%

All General Skills
Midlands

Analytical Skills falls under the General Skills category. For comparison with the information above, the following table provides summary statistics for all contract job vacancies requiring common skills in the Midlands.

Contract vacancies with a requirement for common skills 1,337 1,566 1,766
As % of all contract IT jobs advertised in the Midlands 62.54% 53.67% 54.79%
Number of daily rates quoted 849 1,070 1,259
10th Percentile £200 £206 £231
25th Percentile £331 £350 £363
Median daily rate (50th Percentile) £447 £475 £500
Median % change year-on-year -5.89% -5.00% +5.26%
75th Percentile £538 £600 £600
90th Percentile £638 £725 £700
England median daily rate £525 £534 £550
% change year-on-year -1.66% -2.93% -
Number of hourly rates quoted 96 178 78
10th Percentile £14.00 £11.75 £12.35
25th Percentile £15.27 £13.93 £14.52
Median hourly rate £22.28 £17.50 £22.86
Median % change year-on-year +27.29% -23.45% +21.92%
75th Percentile £32.29 £34.73 £45.25
90th Percentile £50.00 £52.23 £52.55
England median hourly rate £27.76 £31.50 £30.65
% change year-on-year -11.87% +2.78% +36.51%

Analytical Skills
Job Vacancy Trend in the Midlands

Job postings citing Analytical Skills as a proportion of all IT jobs advertised in the Midlands.

Job vacancy trend for Analytical Skills in the Midlands

Analytical Skills
Contractor Daily Rate Trend in the Midlands

3-month moving average daily rate quoted in jobs citing Analytical Skills in the Midlands.

Daily rate trend for Analytical Skills in the Midlands

Analytical Skills
Daily Rate Histogram in the Midlands

Daily rate distribution for jobs citing Analytical Skills in the Midlands over the 6 months to 11 June 2025.

Daily rate histogram for Analytical Skills in the Midlands

Analytical Skills
Contractor Hourly Rate Trend in the Midlands

3-month moving average hourly rates quoted in jobs citing Analytical Skills in the Midlands.

Hourly rate trend for Analytical Skills in the Midlands

Analytical Skills
Hourly Rate Histogram in the Midlands

Hourly rate distribution of jobs citing Analytical Skills in the Midlands over the 6 months to 11 June 2025.

Hourly rate histogram for Analytical Skills in the Midlands

Analytical Skills
Contract Job Locations in the Midlands

The table below looks at the demand and provides a guide to the median contractor rates quoted in IT jobs citing Analytical Skills within the Midlands region over the 6 months to 11 June 2025. The 'Rank Change' column provides an indication of the change in demand within each location based on the same 6 month period last year.

Location Rank Change
on Same Period
Last Year
Matching
Contract
IT Job Ads
Median
Daily Rate
Past 6 Months
Median Daily Rate
% Change
on Same Period
Last Year
Live
Jobs
West Midlands +5 182 £455 -13.33% 356
East Midlands +7 71 £375 -16.67% 236
Analytical Skills
England

Analytical Skills
Co-occurring Skills and Capabilities in the Midlands by Category

The follow tables expand on the table above by listing co-occurrences grouped by category. The same employment type, locality and period is covered with up to 20 co-occurrences shown in each of the following categories:

Application Platforms
1 11 (4.33%) SharePoint
2 7 (2.76%) Confluence
2 7 (2.76%) Oracle Self-Service HR
2 7 (2.76%) Oracle Workflow
3 4 (1.57%) IBM Notes
4 3 (1.18%) Apache Spark
5 2 (0.79%) SAS
6 1 (0.39%) BizTalk Server
6 1 (0.39%) IIS
6 1 (0.39%) MS Project Server
6 1 (0.39%) WebLogic
Applications
1 27 (10.63%) Microsoft Office
2 26 (10.24%) Microsoft Excel
3 12 (4.72%) Microsoft PowerPoint
4 8 (3.15%) Maya
5 5 (1.97%) MS Visio
6 4 (1.57%) Adobe Captivate
6 4 (1.57%) NUKE
7 2 (0.79%) Simulink
8 1 (0.39%) Adobe Illustrator
8 1 (0.39%) Chatbot
8 1 (0.39%) InDesign
8 1 (0.39%) Microsoft Project
8 1 (0.39%) Photoshop
8 1 (0.39%) Spreadsheet
Business Applications
1 6 (2.36%) Oracle HRMS
2 4 (1.57%) Salesforce CRM
3 3 (1.18%) Oracle EBS R12
3 3 (1.18%) Oracle ERP
3 3 (1.18%) Oracle Receivables
3 3 (1.18%) Payment Gateway
3 3 (1.18%) SAP S/4HANA
4 2 (0.79%) Magento
4 2 (0.79%) Maximo
4 2 (0.79%) Oracle Assets
4 2 (0.79%) Oracle EBS
4 2 (0.79%) Oracle General Ledger
4 2 (0.79%) Oracle iProcurement
4 2 (0.79%) Oracle Payables
4 2 (0.79%) SAP MM
4 2 (0.79%) Sprinklr
5 1 (0.39%) Actimize
5 1 (0.39%) Remedy ITSM
5 1 (0.39%) SAP HCM
5 1 (0.39%) Summit
Cloud Services
1 33 (12.99%) Azure
2 32 (12.60%) Power Platform
3 26 (10.24%) AWS
4 18 (7.09%) Microsoft 365
5 11 (4.33%) SuccessFactors
6 10 (3.94%) Entra ID
7 9 (3.54%) GCP
8 8 (3.15%) PowerApps
9 7 (2.76%) Amazon S3
9 7 (2.76%) Azure DevOps
9 7 (2.76%) Cloud Computing
10 6 (2.36%) Power Automate
11 5 (1.97%) Dynamics 365
11 5 (1.97%) SaaS
12 4 (1.57%) Amazon CloudWatch
12 4 (1.57%) Amazon EC2
12 4 (1.57%) Amazon SQS
12 4 (1.57%) AWS KMS
12 4 (1.57%) Route 53
12 4 (1.57%) Serverless
Communications & Networking
1 12 (4.72%) Firewall
2 10 (3.94%) VLAN
2 10 (3.94%) VPN
3 9 (3.54%) Network Security
4 8 (3.15%) BGP
4 8 (3.15%) OSPF
5 6 (2.36%) IPsec
5 6 (2.36%) SSL
5 6 (2.36%) TCP/IP
6 4 (1.57%) LAN
7 3 (1.18%) Internet
7 3 (1.18%) Intrusion Detection
7 3 (1.18%) Wireless
8 2 (0.79%) EIGRP
8 2 (0.79%) SD-WAN
8 2 (0.79%) Telepresence
8 2 (0.79%) Unified Communications
8 2 (0.79%) WAN
8 2 (0.79%) Wi-Fi
9 1 (0.39%) DHCP
Database & Business Intelligence
1 24 (9.45%) Power BI
2 13 (5.12%) Data Warehouse
3 10 (3.94%) Tableau
4 6 (2.36%) NoSQL
4 6 (2.36%) Relational Database
4 6 (2.36%) SQL Server
5 5 (1.97%) Oracle Database
5 5 (1.97%) PostgreSQL
6 4 (1.57%) Amazon Aurora
6 4 (1.57%) Amazon RDS
6 4 (1.57%) DynamoDB
6 4 (1.57%) Power Query
7 3 (1.18%) Amazon Redshift
7 3 (1.18%) Data Lake
7 3 (1.18%) Elasticsearch
7 3 (1.18%) Hadoop
7 3 (1.18%) Metadata
8 2 (0.79%) Azure SQL Database
8 2 (0.79%) Geospatial Data
8 2 (0.79%) MongoDB
Development Applications
1 18 (7.09%) Jenkins
2 11 (4.33%) Git
3 10 (3.94%) Selenium
4 8 (3.15%) Cucumber
4 8 (3.15%) JIRA
5 6 (2.36%) JUnit
5 6 (2.36%) SonarQube
6 5 (1.97%) GitLab
6 5 (1.97%) Maven
6 5 (1.97%) Mockito
7 4 (1.57%) Bitbucket Server
7 4 (1.57%) DbUnit
7 4 (1.57%) JMeter
7 4 (1.57%) jMock
8 3 (1.18%) Oracle Forms
8 3 (1.18%) Postman
8 3 (1.18%) REST Assured
8 3 (1.18%) TestNG
8 3 (1.18%) Travis CI
9 2 (0.79%) NetBeans
General
1 169 (66.54%) Social Skills
2 50 (19.69%) Finance
3 21 (8.27%) Banking
4 20 (7.87%) Automotive
5 18 (7.09%) Inclusion and Diversity
6 12 (4.72%) Public Sector
7 10 (3.94%) Games
8 9 (3.54%) Presentation Skills
8 9 (3.54%) Telecoms
9 8 (3.15%) Legal
10 7 (2.76%) Documentation Skills
10 7 (2.76%) Manufacturing
10 7 (2.76%) Retail
11 6 (2.36%) Organisational Skills
12 5 (1.97%) Law
13 4 (1.57%) Aerospace
14 3 (1.18%) Financial Institution
14 3 (1.18%) Marketing
15 2 (0.79%) Billing
15 2 (0.79%) Local Government
Job Titles
1 68 (26.77%) Analyst
2 29 (11.42%) Business Analyst
3 23 (9.06%) Lead
4 19 (7.48%) Data Analyst
5 16 (6.30%) Architect
5 16 (6.30%) Developer
5 16 (6.30%) Senior
6 14 (5.51%) Consultant
7 13 (5.12%) Desktop Engineer
8 10 (3.94%) Tester
8 10 (3.94%) Windows Engineer
9 9 (3.54%) Support Engineer
10 8 (3.15%) Product Manager
11 6 (2.36%) Automation Tester
11 6 (2.36%) Check Point Expert
11 6 (2.36%) Java Developer
11 6 (2.36%) Junior
11 6 (2.36%) Oracle Specialist
11 6 (2.36%) Service Analyst
11 6 (2.36%) Service Desk Analyst
Libraries, Frameworks & Software Standards
1 20 (7.87%) HTML
2 13 (5.12%) CSS
3 10 (3.94%) LDAP
4 9 (3.54%) .NET
4 9 (3.54%) REST
5 8 (3.15%) Django
6 7 (2.76%) jQuery
6 7 (2.76%) RESTful
7 6 (2.36%) DOM
7 6 (2.36%) Spring
8 5 (1.97%) Hibernate
8 5 (1.97%) Kafka
8 5 (1.97%) SailPoint
8 5 (1.97%) Web Services
9 4 (1.57%) AngularJS
9 4 (1.57%) Bootstrap
9 4 (1.57%) PowerMock
9 4 (1.57%) Spring Batch
9 4 (1.57%) Spring Integration
9 4 (1.57%) Unreal Engine
Miscellaneous
1 13 (5.12%) Data Structures
1 13 (5.12%) Management Information System
2 12 (4.72%) Product Ownership
3 11 (4.33%) Self-Motivation
4 10 (3.94%) Onboarding
5 9 (3.54%) Analytical Mindset
6 8 (3.15%) Animation
7 7 (2.76%) Data Centre
7 7 (2.76%) Data Protection Act
7 7 (2.76%) IoT
8 6 (2.36%) Security Posture
9 5 (1.97%) Industry 4.0
10 4 (1.57%) Algorithms
10 4 (1.57%) Cloud Native
10 4 (1.57%) Distributed Systems
10 4 (1.57%) Operational Technology
10 4 (1.57%) Virtual Reality
11 3 (1.18%) Driving Licence
11 3 (1.18%) Enterprise Software
12 2 (0.79%) Pricing Data
Operating Systems
1 24 (9.45%) Windows
2 17 (6.69%) Linux
3 11 (4.33%) Windows 10
4 6 (2.36%) Check Point GAiA
5 4 (1.57%) Mac OS
6 2 (0.79%) Android
6 2 (0.79%) Unix
7 1 (0.39%) Apple iOS
Processes & Methodologies
1 148 (58.27%) Problem-Solving
2 56 (22.05%) Agile
3 41 (16.14%) Data Analysis
4 39 (15.35%) Stakeholder Management
5 37 (14.57%) Business Intelligence
6 35 (13.78%) Visualisation
7 34 (13.39%) Project Management
8 33 (12.99%) Decision-Making
9 32 (12.60%) Continuous Improvement
10 29 (11.42%) Computer Science
11 27 (10.63%) Analytical Thinking
12 26 (10.24%) Data Modelling
13 24 (9.45%) Analytics
14 23 (9.06%) ITIL
15 22 (8.66%) DevOps
16 20 (7.87%) Risk Management
17 19 (7.48%) Test Automation
17 19 (7.48%) Workflow
18 18 (7.09%) Cybersecurity
18 18 (7.09%) Data Governance
Programming Languages
1 61 (24.02%) SQL
2 31 (12.20%) Java
3 28 (11.02%) Python
4 12 (4.72%) PowerShell
5 10 (3.94%) C++
6 9 (3.54%) JavaScript
7 8 (3.15%) C#
8 7 (2.76%) Bash
9 4 (1.57%) Tcl
10 3 (1.18%) Data Analysis Expressions
10 3 (1.18%) PL/SQL
10 3 (1.18%) R
11 2 (0.79%) Apex Code
11 2 (0.79%) Bicep
11 2 (0.79%) C
11 2 (0.79%) Scala
11 2 (0.79%) VB.NET
11 2 (0.79%) VBA
12 1 (0.39%) RPG
12 1 (0.39%) Shell Script
Qualifications
1 49 (19.29%) Degree
2 27 (10.63%) Security Cleared
3 24 (9.45%) Computer Science Degree
4 21 (8.27%) SC Cleared
5 6 (2.36%) CCSE
5 6 (2.36%) CEH
5 6 (2.36%) CISSP
6 5 (1.97%) Cisco Certification
6 5 (1.97%) ITIL Foundation Certificate
7 4 (1.57%) BPSS Clearance
7 4 (1.57%) HNC
7 4 (1.57%) HND
7 4 (1.57%) ISTQB
8 3 (1.18%) AWS Certification
8 3 (1.18%) Azure Certification
8 3 (1.18%) CCENT
8 3 (1.18%) CCNA
8 3 (1.18%) Microsoft Certification
8 3 (1.18%) Network+ Certification
9 2 (0.79%) CBAP
Quality Assurance & Compliance
1 26 (10.24%) QA
2 20 (7.87%) Data Quality
3 13 (5.12%) SLA
4 10 (3.94%) GDPR
5 9 (3.54%) NIST
6 6 (2.36%) PMO
7 4 (1.57%) ISO/IEC 27001
8 3 (1.18%) NIST 800
9 2 (0.79%) HIPAA
9 2 (0.79%) MISRA
9 2 (0.79%) MISRA C
9 2 (0.79%) NCSC
9 2 (0.79%) PCI DSS
9 2 (0.79%) Software Quality Assurance
10 1 (0.39%) Actionable Recommendations
10 1 (0.39%) COSHH
10 1 (0.39%) GRC
10 1 (0.39%) IEC 61508
10 1 (0.39%) P3O
10 1 (0.39%) Sarbanes-Oxley
System Software
1 24 (9.45%) Active Directory
2 14 (5.51%) Docker
3 4 (1.57%) Postfix
4 2 (0.79%) BitLocker
5 1 (0.39%) Oracle RAC
5 1 (0.39%) Virtual Machines
Systems Management
1 10 (3.94%) Kubernetes
2 6 (2.36%) FortiGate
2 6 (2.36%) Single Sign-On
3 4 (1.57%) Grafana
3 4 (1.57%) Prometheus
3 4 (1.57%) SCCM
3 4 (1.57%) Terraform
4 3 (1.18%) Ansible
4 3 (1.18%) Kibana
4 3 (1.18%) Microsoft Intune
5 1 (0.39%) Data Guard
5 1 (0.39%) Oracle Enterprise Manager
5 1 (0.39%) Oracle RMAN
5 1 (0.39%) Tivoli Identity Manager
Vendors
1 54 (21.26%) Microsoft
2 27 (10.63%) SAP
3 24 (9.45%) Oracle
4 17 (6.69%) ServiceNow
5 9 (3.54%) Cisco
6 8 (3.15%) Adobe
7 7 (2.76%) Salesforce
8 6 (2.36%) CheckPoint
8 6 (2.36%) Fortinet
9 5 (1.97%) Apple
9 5 (1.97%) Atlassian
10 4 (1.57%) Autodesk
10 4 (1.57%) CyberArk
10 4 (1.57%) IBM
10 4 (1.57%) Jaspersoft
10 4 (1.57%) Lotus
11 2 (0.79%) Civica
11 2 (0.79%) Databricks
11 2 (0.79%) Nexthink
11 2 (0.79%) Workday