Analytical Skills Job Trends in the Midlands

Analytical Skills
England > Midlands

The table below looks at the prevalence of the term Analytical Skills in permanent job vacancies in the Midlands. Included is a benchmarking guide to the salaries offered in vacancies that cited Analytical Skills over the 6 months leading up to 19 November 2025, comparing them to the same period in the previous two years.

6 months to
19 Nov 2025
Same period 2024 Same period 2023
Rank 7 13 13
Rank change year-on-year +6 0 -1
Permanent jobs citing Analytical Skills 651 853 539
As % of all permanent jobs in the Midlands 11.16% 9.71% 10.73%
As % of the General category 18.61% 17.45% 16.50%
Number of salaries quoted 344 242 417
10th Percentile £27,000 £27,500 £28,100
25th Percentile £31,250 £35,000 £33,500
Median annual salary (50th Percentile) £44,272 £49,000 £50,000
Median % change year-on-year -9.65% -2.00% +5.26%
75th Percentile £63,750 £62,500 £63,250
90th Percentile £79,250 £74,825 £71,250
England median annual salary £50,000 £55,000 £57,500
% change year-on-year -9.09% -4.35% +4.55%

All General Skills
Midlands

Analytical Skills falls under the General Skills category. For comparison with the information above, the following table provides summary statistics for all permanent job vacancies requiring common skills in the Midlands.

Permanent vacancies with a requirement for common skills 3,499 4,887 3,267
As % of all permanent jobs advertised in the Midlands 59.97% 55.64% 65.01%
Number of salaries quoted 2,311 1,975 2,544
10th Percentile £26,750 £30,000 £26,500
25th Percentile £31,250 £37,500 £33,000
Median annual salary (50th Percentile) £43,000 £50,000 £50,000
Median % change year-on-year -14.00% - -
75th Percentile £61,813 £65,000 £63,500
90th Percentile £77,500 £77,500 £76,250
England median annual salary £52,500 £60,000 £60,000
% change year-on-year -12.50% - -

Analytical Skills
Job Vacancy Trend in the Midlands

Historical trend showing the proportion of permanent IT job postings citing Analytical Skills relative to all permanent IT jobs advertised in the Midlands.
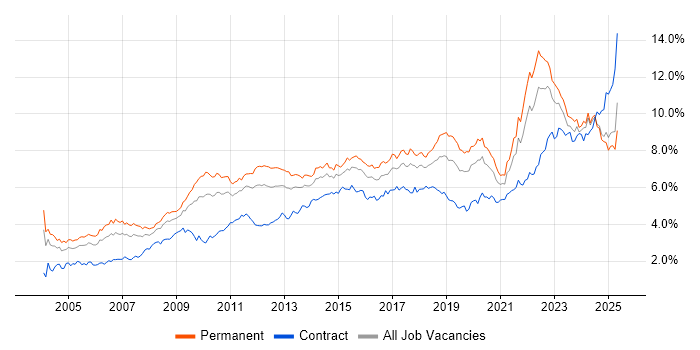
Analytical Skills job vacancy trend in the Midlands

Analytical Skills
Salary Trend in the Midlands

Salary distribution trend for jobs in the Midlands citing Analytical Skills.

Salary distribution trend for jobs in the Midlands citing Analytical Skills

Analytical Skills
Salary Histogram in the Midlands

Salary distribution for jobs citing Analytical Skills in the Midlands over the 6 months to 19 November 2025.

Salary histogram for Analytical Skills in the Midlands

Analytical Skills
Job Locations in the Midlands

The table below looks at the demand and provides a guide to the median salaries quoted in IT jobs citing Analytical Skills within the Midlands region over the 6 months to 19 November 2025. The 'Rank Change' column provides an indication of the change in demand within each location based on the same 6 month period last year.

Location Rank Change
on Same Period
Last Year
Matching
Permanent
IT Job Ads
Median Salary
Past 6 Months
Median Salary
% Change
on Same Period
Last Year
Live
Jobs
West Midlands +7 385 £52,500 +5.00% 346
East Midlands +5 264 £37,500 -11.76% 238
Analytical Skills
England

Analytical Skills
Co-Occurring Skills & Capabilities in the Midlands by Category

The following tables expand on the one above by listing co-occurrences grouped by category. They cover the same employment type, locality and period, with up to 20 co-occurrences shown in each category:

Application Platforms
1 9 (1.38%) Confluence
2 7 (1.08%) SharePoint
3 4 (0.61%) CMS
4 3 (0.46%) WordPress
5 2 (0.31%) Apache Spark
5 2 (0.31%) Microsoft Exchange
6 1 (0.15%) Apache Airflow
6 1 (0.15%) ArcGIS
6 1 (0.15%) HCL Notes
6 1 (0.15%) Oracle SOA Suite
6 1 (0.15%) SAS
Applications
1 93 (14.29%) Chatbot
2 75 (11.52%) Microsoft Excel
3 40 (6.14%) Microsoft Office
4 8 (1.23%) Microsoft PowerPoint
4 8 (1.23%) Spreadsheet
5 4 (0.61%) CATIA
5 4 (0.61%) MS Visio
6 2 (0.31%) AutoCAD
6 2 (0.31%) SOLIDWORKS
6 2 (0.31%) Trello
7 1 (0.15%) Camtasia
7 1 (0.15%) Microsoft Project
7 1 (0.15%) SmartSuite
Business Applications
1 22 (3.38%) SAP S/4HANA
2 14 (2.15%) Dynamics CRM
3 12 (1.84%) Sprinklr
4 6 (0.92%) NetSuite
5 4 (0.61%) Shopify
6 3 (0.46%) Oracle Payables
7 2 (0.31%) Magento
7 2 (0.31%) NEC Housing
7 2 (0.31%) Oracle Cash Management
7 2 (0.31%) SAP Business One
7 2 (0.31%) SAP CO
7 2 (0.31%) SAP ERP
7 2 (0.31%) SAP FI
7 2 (0.31%) SAP FI/CO
8 1 (0.15%) Dynamics GP
8 1 (0.15%) HFM
8 1 (0.15%) Oracle EBS
8 1 (0.15%) Oracle SCM
8 1 (0.15%) Pegasus Opera
8 1 (0.15%) Primavera
Cloud Services
1 66 (10.14%) Azure
2 58 (8.91%) SaaS
3 55 (8.45%) Power Platform
4 21 (3.23%) AWS
5 15 (2.30%) Microsoft 365
6 13 (2.00%) Dynamics 365
7 10 (1.54%) Entra ID
7 10 (1.54%) OCI
8 9 (1.38%) Cloud Computing
9 8 (1.23%) Azure Data Factory
10 7 (1.08%) Azure DevOps
10 7 (1.08%) Azure Synapse Analytics
10 7 (1.08%) Google Ads
10 7 (1.08%) Google Analytics
11 6 (0.92%) PaaS
11 6 (0.92%) Power Automate
11 6 (0.92%) PowerApps
11 6 (0.92%) Snowflake
12 5 (0.77%) Azure Logic Apps
12 5 (0.77%) GCP
Communications & Networking
1 39 (5.99%) Remote Desktop
2 10 (1.54%) VPN
3 8 (1.23%) Firewall
4 5 (0.77%) Network Security
4 5 (0.77%) VLAN
4 5 (0.77%) WAN
5 4 (0.61%) HTTP
5 4 (0.61%) SMS
6 3 (0.46%) Intrusion Detection
6 3 (0.46%) LAN
7 2 (0.31%) SAN
7 2 (0.31%) SD-WAN
7 2 (0.31%) Wi-Fi
8 1 (0.15%) 4G
8 1 (0.15%) 5G
8 1 (0.15%) Cisco Nexus
8 1 (0.15%) Ethernet VPN
8 1 (0.15%) RS-232
8 1 (0.15%) RS-485
8 1 (0.15%) VXLAN
Database & Business Intelligence
1 48 (7.37%) Power BI
2 22 (3.38%) Tableau
3 19 (2.92%) Looker
3 19 (2.92%) SQL Server
4 16 (2.46%) Data Mining
5 13 (2.00%) Metadata
6 11 (1.69%) SQL Server Reporting Services
7 9 (1.38%) Azure SQL Database
7 9 (1.38%) Data Lake
8 8 (1.23%) Oracle Reports
9 7 (1.08%) Relational Database
9 7 (1.08%) SQL Server Integration Services
10 6 (0.92%) MySQL
11 5 (0.77%) BusinessObjects
11 5 (0.77%) Data Warehouse
12 4 (0.61%) Crystal Reports
13 3 (0.46%) Azure SQL Data Warehouse
13 3 (0.46%) Oracle Database
13 3 (0.46%) SAP BW
14 2 (0.31%) Electronic Patient Records
Development Applications
1 18 (2.76%) JIRA
2 6 (0.92%) Selenium
3 2 (0.31%) Git
3 2 (0.31%) JUnit
3 2 (0.31%) Postman
4 1 (0.15%) Bitbucket Server
4 1 (0.15%) DbUnit
4 1 (0.15%) ERwin
4 1 (0.15%) GitLab
4 1 (0.15%) Jenkins
4 1 (0.15%) JMeter
4 1 (0.15%) jMock
4 1 (0.15%) Katalon Studio
4 1 (0.15%) Mockito
4 1 (0.15%) SonarQube
4 1 (0.15%) Sonatype Nexus
4 1 (0.15%) TestComplete
4 1 (0.15%) TestRail
4 1 (0.15%) Visual Studio
4 1 (0.15%) WebDriver
General
1 283 (43.47%) Social Skills
2 139 (21.35%) Finance
3 114 (17.51%) Retail
4 107 (16.44%) Marketing
5 40 (6.14%) Manufacturing
6 35 (5.38%) Law
7 28 (4.30%) Legal
8 26 (3.99%) Public Sector
9 21 (3.23%) Organisational Skills
9 21 (3.23%) Presentation Skills
10 16 (2.46%) Inclusion and Diversity
11 14 (2.15%) Banking
11 14 (2.15%) Documentation Skills
12 8 (1.23%) Influencing Skills
13 7 (1.08%) Social Housing
14 6 (0.92%) Aerospace
14 6 (0.92%) Financial Institution
15 5 (0.77%) Advertising
16 4 (0.61%) Local Government
17 3 (0.46%) Publishing
Job Titles
1 140 (21.51%) Analyst
2 92 (14.13%) Trainer
3 68 (10.45%) Lead
4 47 (7.22%) 2nd Line Support
4 47 (7.22%) Senior
5 41 (6.30%) Developer
6 33 (5.07%) Support Analyst
7 32 (4.92%) Architect
8 27 (4.15%) 1st/2nd Line Support
9 26 (3.99%) Software Analyst
10 23 (3.53%) Consultant
10 23 (3.53%) Support Technician
11 21 (3.23%) Support Engineer
11 21 (3.23%) Technical Support
12 19 (2.92%) Data Analyst
13 17 (2.61%) 2nd Line Support Technician
13 17 (2.61%) Applications Support
13 17 (2.61%) ERP Support
13 17 (2.61%) Senior Analyst
14 16 (2.46%) Digital Transformation
Libraries, Frameworks & Software Standards
1 24 (3.69%) HTML
2 22 (3.38%) CSS
2 22 (3.38%) REST
3 19 (2.92%) SOAP
4 17 (2.61%) Middleware
5 14 (2.15%) BAPI
5 14 (2.15%) IBM Integration Bus
5 14 (2.15%) JMS
5 14 (2.15%) OAuth
5 14 (2.15%) SAML
6 13 (2.00%) Oracle Fusion
7 9 (1.38%) .NET
7 9 (1.38%) React
8 8 (1.23%) Flash
9 6 (0.92%) AngularJS
10 5 (0.77%) EDI
10 5 (0.77%) Web Services
11 4 (0.61%) Elastic Stack
11 4 (0.61%) JSON
11 4 (0.61%) Playwright
Miscellaneous
1 130 (19.97%) Onboarding
2 76 (11.67%) Analytical Mindset
3 33 (5.07%) Management Information System
4 32 (4.92%) Self-Motivation
5 24 (3.69%) Driving Licence
6 21 (3.23%) FMCG
7 15 (2.30%) Enterprise Software
8 11 (1.69%) Data Structures
8 11 (1.69%) e-Learning
9 10 (1.54%) Security Posture
10 9 (1.38%) IoT
10 9 (1.38%) Legacy Systems
11 8 (1.23%) Social Media
12 6 (0.92%) Cyber Defence
12 6 (0.92%) Product Ownership
13 5 (0.77%) Cyber Threat
14 4 (0.61%) Data Centre
14 4 (0.61%) Foreign Exchange (FX)
14 4 (0.61%) Reference Data
14 4 (0.61%) SCADA
Operating Systems
1 23 (3.53%) Windows
2 16 (2.46%) Linux
3 5 (0.77%) Mac OS X
4 3 (0.46%) Unix
5 2 (0.31%) Windows 10
6 1 (0.15%) Android
6 1 (0.15%) Apple iOS
6 1 (0.15%) Mac OS
6 1 (0.15%) OpenVMS
6 1 (0.15%) Oracle Linux
6 1 (0.15%) Red Hat Enterprise Linux
6 1 (0.15%) Windows Server
6 1 (0.15%) Windows Server 2016
Processes & Methodologies
1 271 (41.63%) Problem-Solving
2 199 (30.57%) Continuous Improvement
3 169 (25.96%) CRM
4 138 (21.20%) Analytics
5 121 (18.59%) AI
6 117 (17.97%) ERP
7 109 (16.74%) E-Commerce
8 107 (16.44%) Decision-Making
9 103 (15.82%) Customer Service
10 99 (15.21%) Stakeholder Management
11 94 (14.44%) Chemistry
12 93 (14.29%) Conversational UI
13 82 (12.60%) Project Management
14 79 (12.14%) Collaborative Working
15 76 (11.67%) Analytical Thinking
16 75 (11.52%) Digital Marketing
17 74 (11.37%) Mentoring
18 73 (11.21%) Digital Innovation
19 72 (11.06%) Customer Experience
19 72 (11.06%) Dashboard Development
Programming Languages
1 149 (22.89%) SQL
2 49 (7.53%) C#
3 35 (5.38%) Python
4 28 (4.30%) JavaScript
5 14 (2.15%) T-SQL
6 9 (1.38%) PowerShell
7 8 (1.23%) Data Analysis Expressions
7 8 (1.23%) R
8 5 (0.77%) ABAP
8 5 (0.77%) Java
9 4 (0.61%) Bash
10 2 (0.31%) Perl
10 2 (0.31%) PL/SQL
11 1 (0.15%) C++
11 1 (0.15%) Groovy
11 1 (0.15%) Scala
11 1 (0.15%) Shell Script
11 1 (0.15%) TypeScript
11 1 (0.15%) VB
11 1 (0.15%) VB.NET
Qualifications
1 259 (39.78%) Degree
2 100 (15.36%) Master's Degree
3 95 (14.59%) PhD
4 37 (5.68%) Security Cleared
5 26 (3.99%) Computer Science Degree
5 26 (3.99%) SC Cleared
6 14 (2.15%) CISSP
7 13 (2.00%) DBS Check
8 11 (1.69%) ACCA
8 11 (1.69%) Microsoft Certification
9 10 (1.54%) AAT
10 9 (1.38%) CIMA
10 9 (1.38%) CISM
11 8 (1.23%) Cisco Certification
12 6 (0.92%) (ISC)2 CCSP
12 6 (0.92%) ITIL Certification
13 5 (0.77%) MCP
13 5 (0.77%) MCSA
13 5 (0.77%) MCSE
13 5 (0.77%) TOGAF Certification
Quality Assurance & Compliance
1 47 (7.22%) QA
2 29 (4.45%) Data Quality
3 24 (3.69%) GDPR
4 19 (2.92%) ISO/IEC 27001
5 12 (1.84%) PMO
6 11 (1.69%) NIST
6 11 (1.69%) SLA
7 4 (0.61%) Actionable Recommendations
8 2 (0.31%) COBIT
8 2 (0.31%) Cyber Essentials
8 2 (0.31%) IEC 61131
8 2 (0.31%) IFRS
8 2 (0.31%) ISO 20022
9 1 (0.15%) Accessibility
9 1 (0.15%) HIPAA
9 1 (0.15%) ISO 9001
9 1 (0.15%) P3O
9 1 (0.15%) PCI DSS
9 1 (0.15%) Sarbanes-Oxley
9 1 (0.15%) SOC 2
System Software
1 27 (4.15%) Active Directory
2 11 (1.69%) Firmware
3 5 (0.77%) Hyper-V
3 5 (0.77%) VMware Infrastructure
4 4 (0.61%) vSphere
5 2 (0.31%) Docker
6 1 (0.15%) BitLocker
6 1 (0.15%) Postfix
Systems Management
1 6 (0.92%) Microsoft Intune
2 4 (0.61%) Terraform
3 3 (0.46%) Kubernetes
4 2 (0.31%) Ansible
4 2 (0.31%) Kibana
5 1 (0.15%) AirWatch
5 1 (0.15%) FortiGate
5 1 (0.15%) Grafana
5 1 (0.15%) Jamf Pro
5 1 (0.15%) Prometheus
Vendors
1 105 (16.13%) Microsoft
2 92 (14.13%) PayPal
3 71 (10.91%) SAP
4 26 (3.99%) Oracle
4 26 (3.99%) Salesforce
5 15 (2.30%) Google
5 15 (2.30%) IBM
6 14 (2.15%) Databricks
7 12 (1.84%) Adobe
7 12 (1.84%) Cisco
8 7 (1.08%) Zoho
9 6 (0.92%) Salesforce Marketing Cloud
9 6 (0.92%) ServiceNow
9 6 (0.92%) VMware
10 5 (0.77%) Epicor
10 5 (0.77%) Infor
10 5 (0.77%) SonicWALL
11 4 (0.61%) Facebook
11 4 (0.61%) LogRhythm
11 4 (0.61%) Sage