Azure Contract Job Trends in the North West

Microsoft Azure
England > North West

The table below provides summary statistics and contractor rates for jobs advertised in the North West requiring Azure skills. It covers contract job vacancies from the 6 months leading up to 23 November 2025, with comparisons to the same periods in the previous two years.

6 months to
23 Nov 2025
Same period 2024 Same period 2023
Rank 9 8 3
Rank change year-on-year -1 -5 -1
Contract jobs citing Azure 287 263 424
As % of all contract jobs in the North West 11.81% 11.14% 15.42%
As % of the Cloud Services category 34.45% 36.28% 41.98%
Number of daily rates quoted 215 168 327
10th Percentile £321 £310 £287
25th Percentile £400 £400 £400
Median daily rate (50th Percentile) £475 £500 £495
Median % change year-on-year -5.00% +1.01% -5.71%
75th Percentile £575 £578 £575
90th Percentile £637 £675 £650
England median daily rate £525 £530 £550
% change year-on-year -0.94% -3.64% -4.35%
Number of hourly rates quoted 10 4 26
10th Percentile - £34.50 £18.13
25th Percentile £15.50 £42.01 £27.48
Median hourly rate £17.44 £46.18 £46.18
Median % change year-on-year -62.25% - -30.03%
75th Percentile £61.80 £54.01 -
90th Percentile £67.95 £68.10 -
England median hourly rate £45.73 £40.59 £46.18
% change year-on-year +12.66% -12.10% -8.55%

All Cloud Skills
North West

Azure falls under the Cloud Services category. For comparison with the information above, the following table provides summary statistics for all contract job vacancies requiring cloud computing skills in the North West.

Contract vacancies with a requirement for cloud computing skills 833 725 1,010
As % of all contract IT jobs advertised in the North West 34.28% 30.72% 36.73%
Number of daily rates quoted 644 455 762
10th Percentile £300 £300 £265
25th Percentile £363 £395 £375
Median daily rate (50th Percentile) £448 £485 £495
Median % change year-on-year -7.73% -2.02% -1.00%
75th Percentile £550 £575 £575
90th Percentile £638 £648 £650
England median daily rate £500 £538 £525
% change year-on-year -6.98% +2.38% -4.55%
Number of hourly rates quoted 34 16 52
10th Percentile £15.50 £17.44 £16.03
25th Percentile £16.72 £21.05 £18.31
Median hourly rate £23.31 £30.00 £34.00
Median % change year-on-year -22.32% -11.76% +60.00%
75th Percentile £67.25 £49.14 £46.18
90th Percentile £73.06 £73.63 £61.90
England median hourly rate £25.47 £33.93 £26.75
% change year-on-year -24.93% +26.84% +18.89%

Azure
Job Vacancy Trend in the North West

Historical trend showing the proportion of contract IT job postings citing Azure relative to all contract IT jobs advertised in the North West.
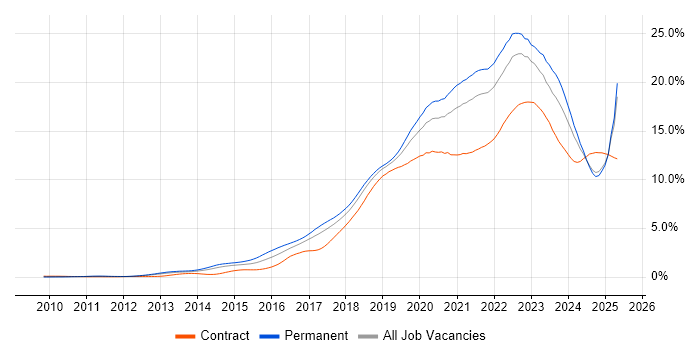
Azure job vacancy trend in the North West

Azure
Daily Rate Trend in the North West

Contractor daily rate distribution trend for jobs in the North West citing Azure.

Contractor daily rate distribution trend for jobs in the North West citing Azure

Azure
Daily Rate Histogram in the North West

Daily rate distribution for jobs citing Azure in the North West over the 6 months to 23 November 2025.

Daily rate histogram for Azure in the North West

Azure
Hourly Rate Trend in the North West

Contractor hourly rate distribution trend for jobs in the North West citing Azure.

Contractor hourly rate distribution trend for jobs in the North West citing Azure

Azure
Hourly Rate Histogram in the North West

Hourly rate distribution of jobs citing Azure in the North West over the 6 months to 23 November 2025.

Hourly rate histogram for Azure in the North West

Azure
Contract Job Locations in the North West

The table below looks at the demand and provides a guide to the median contractor rates quoted in IT jobs citing Azure within the North West region over the 6 months to 23 November 2025. The 'Rank Change' column provides an indication of the change in demand within each location based on the same 6 month period last year.

Location Rank Change
on Same Period
Last Year
Matching
Contract
IT Job Ads
Median
Daily Rate
Past 6 Months
Median Daily Rate
% Change
on Same Period
Last Year
Live
Jobs
Manchester -3 148 £488 -5.11% 170
Cheshire +5 86 £481 -1.58% 45
Merseyside -4 31 £425 +6.25% 33
Lancashire -2 16 £450 -4.26% 152
Azure
England

Azure
Co-Occurring Skills & Capabilities in the North West by Category

The following tables expand on the one above by listing co-occurrences grouped by category. They cover the same employment type, locality and period, with up to 20 co-occurrences shown in each category:

Application Platforms
1 26 (9.06%) SharePoint
2 11 (3.83%) Microsoft Exchange
3 8 (2.79%) Confluence
4 7 (2.44%) Exchange Server 2013
4 7 (2.44%) SAS
4 7 (2.44%) Skype for Business
5 5 (1.74%) WebSphere
6 4 (1.39%) Apache Spark
6 4 (1.39%) OpenStack
7 3 (1.05%) Apache
8 2 (0.70%) IIS
8 2 (0.70%) NetWeaver
8 2 (0.70%) WebSphere Application Server
9 1 (0.35%) Apache Airflow
Applications
1 14 (4.88%) Microsoft Office
2 9 (3.14%) Microsoft Excel
3 7 (2.44%) Microsoft PowerPoint
3 7 (2.44%) MS Visio
4 6 (2.09%) Chatbot
Business Applications
1 6 (2.09%) Dynamics CRM
2 5 (1.74%) Payment Gateway
3 1 (0.35%) Dynamics NAV
3 1 (0.35%) SAP S/4HANA
3 1 (0.35%) SAP SCM
Cloud Services
1 121 (42.16%) AWS
2 83 (28.92%) GCP
3 63 (21.95%) Microsoft 365
4 46 (16.03%) Azure DevOps
5 44 (15.33%) Power Platform
6 29 (10.10%) GitHub
7 25 (8.71%) Entra ID
8 19 (6.62%) SaaS
9 15 (5.23%) Serverless
10 13 (4.53%) Power Automate
10 13 (4.53%) PowerApps
11 12 (4.18%) GitHub Actions
12 10 (3.48%) Azure Logic Apps
12 10 (3.48%) Datadog
12 10 (3.48%) Dynamics 365
12 10 (3.48%) Figma
13 9 (3.14%) Azure Sentinel
13 9 (3.14%) OneDrive
13 9 (3.14%) OpenShift
14 8 (2.79%) AWS CloudFormation
Communications & Networking
1 22 (7.67%) Firewall
2 12 (4.18%) DNS
3 7 (2.44%) Internet
3 7 (2.44%) Skype
3 7 (2.44%) TCP/IP
3 7 (2.44%) Wi-Fi
4 6 (2.09%) Network Security
4 6 (2.09%) SAN
4 6 (2.09%) VPN
5 5 (1.74%) Unified Communications
5 5 (1.74%) VLAN
6 4 (1.39%) BGP
6 4 (1.39%) LAN
6 4 (1.39%) WAN
7 3 (1.05%) Cisco IOS
7 3 (1.05%) iSCSI
7 3 (1.05%) NX-OS
7 3 (1.05%) WLAN
8 2 (0.70%) Calico
8 2 (0.70%) NetScaler
Database & Business Intelligence
1 25 (8.71%) Power BI
2 16 (5.57%) Data Warehouse
3 11 (3.83%) SQL Server
4 10 (3.48%) BigQuery
4 10 (3.48%) PostgreSQL
5 9 (3.14%) Azure SQL Database
6 8 (2.79%) Looker
6 8 (2.79%) Relational Database
7 7 (2.44%) Data Lake
7 7 (2.44%) MySQL
8 6 (2.09%) Amazon RDS
8 6 (2.09%) Metadata
8 6 (2.09%) NoSQL
9 5 (1.74%) DynamoDB
9 5 (1.74%) Redis
10 4 (1.39%) Amazon Aurora
10 4 (1.39%) Pinecone
10 4 (1.39%) RDBMS
11 3 (1.05%) Delta Lake
12 2 (0.70%) Amazon Athena
Development Applications
1 29 (10.10%) Git
1 29 (10.10%) JIRA
2 25 (8.71%) Jenkins
3 17 (5.92%) GitLab
4 10 (3.48%) Gradle
5 8 (2.79%) SonarQube
6 6 (2.09%) Maven
6 6 (2.09%) Postman
6 6 (2.09%) Storybook
6 6 (2.09%) Xcode
7 5 (1.74%) Selenium
8 4 (1.39%) Bitbucket
8 4 (1.39%) JUnit
8 4 (1.39%) Snyk
8 4 (1.39%) SonarLint
9 3 (1.05%) Cucumber
10 2 (0.70%) Cypress.io
10 2 (0.70%) Fiddler
10 2 (0.70%) git-flow
10 2 (0.70%) Hudson
General
1 91 (31.71%) Social Skills
2 64 (22.30%) Public Sector
3 47 (16.38%) Finance
4 41 (14.29%) Banking
5 39 (13.59%) Analytical Skills
6 11 (3.83%) Documentation Skills
7 8 (2.79%) Military
8 7 (2.44%) Inclusion and Diversity
8 7 (2.44%) Retail
9 6 (2.09%) Influencing Skills
10 5 (1.74%) Marketing
11 4 (1.39%) Games
11 4 (1.39%) Law
12 3 (1.05%) Japanese Language
12 3 (1.05%) Manufacturing
12 3 (1.05%) Telecoms
13 2 (0.70%) Legal
14 1 (0.35%) Automotive
14 1 (0.35%) Local Government
14 1 (0.35%) Presentation Skills
Job Titles
1 52 (18.12%) Developer
2 51 (17.77%) Architect
3 28 (9.76%) Analyst
4 26 (9.06%) Senior
5 19 (6.62%) Security Engineer
6 16 (5.57%) Azure Engineer
6 16 (5.57%) Solutions Architect
7 15 (5.23%) Java Developer
8 13 (4.53%) Cloud Engineer
8 13 (4.53%) IT Support
8 13 (4.53%) Lead
8 13 (4.53%) Technical Architect
9 12 (4.18%) Platform Engineer
9 12 (4.18%) Support Engineer
10 10 (3.48%) Senior Developer
11 9 (3.14%) Data Engineer
11 9 (3.14%) DevOps Engineer
12 8 (2.79%) Change Manager
12 8 (2.79%) IT Engineer
12 8 (2.79%) Support Analyst
Libraries, Frameworks & Software Standards
1 28 (9.76%) Spring Boot
2 23 (8.01%) Spring
3 15 (5.23%) REST
4 14 (4.88%) RESTful
5 13 (4.53%) JSON
6 12 (4.18%) .NET
6 12 (4.18%) OAuth
7 10 (3.48%) HTML
8 9 (3.14%) React
9 8 (2.79%) JMS
9 8 (2.79%) Node.js
10 7 (2.44%) AngularJS
10 7 (2.44%) D3.js
10 7 (2.44%) React Native
11 6 (2.09%) Elastic Stack
11 6 (2.09%) HTML5 Canvas
11 6 (2.09%) Middleware
11 6 (2.09%) SVG
12 5 (1.74%) J2EE
12 5 (1.74%) Kafka
Miscellaneous
1 24 (8.36%) Cloud Native
2 23 (8.01%) Onboarding
3 14 (4.88%) Distributed Systems
4 12 (4.18%) Product Ownership
5 11 (3.83%) Low-Code
6 10 (3.48%) Data Protection Act
7 9 (3.14%) Mobile App
8 8 (2.79%) SWIFT Messaging Network
9 7 (2.44%) Credit Risk
9 7 (2.44%) Data Centre
9 7 (2.44%) Enterprise Software
9 7 (2.44%) Legacy Systems
10 5 (1.74%) Clustering
10 5 (1.74%) N-Tier
10 5 (1.74%) Replication
10 5 (1.74%) Video Conferencing
11 4 (1.39%) Autonomous Agent
11 4 (1.39%) Distributed Computing
11 4 (1.39%) Legacy Applications
11 4 (1.39%) NHS
Operating Systems
1 39 (13.59%) Windows
2 18 (6.27%) Linux
3 11 (3.83%) Android
4 10 (3.48%) Windows Server
5 9 (3.14%) Apple iOS
5 9 (3.14%) Windows 10
6 3 (1.05%) Unix
7 1 (0.35%) VMS
Processes & Methodologies
1 102 (35.54%) DevOps
2 83 (28.92%) CI/CD
3 68 (23.69%) Agile
4 55 (19.16%) Problem-Solving
5 47 (16.38%) Containerisation
6 37 (12.89%) Analytics
7 36 (12.54%) Infrastructure as Code
7 36 (12.54%) Migration
8 34 (11.85%) Stakeholder Management
9 32 (11.15%) Microservices
10 31 (10.80%) Business Intelligence
10 31 (10.80%) Machine Learning
11 27 (9.41%) AI
12 26 (9.06%) Mentoring
13 25 (8.71%) User Experience
14 24 (8.36%) Roadmaps
14 24 (8.36%) Stakeholder Engagement
15 22 (7.67%) Continuous Improvement
15 22 (7.67%) Cybersecurity
16 21 (7.32%) Validation
Programming Languages
1 62 (21.60%) Python
2 47 (16.38%) SQL
3 39 (13.59%) Java
4 18 (6.27%) PowerShell
5 16 (5.57%) JavaScript
6 15 (5.23%) C#
7 14 (4.88%) TypeScript
8 13 (4.53%) Bash
9 7 (2.44%) R
10 5 (1.74%) Go
10 5 (1.74%) Kusto Query Language
11 4 (1.39%) Bicep
11 4 (1.39%) Scala
11 4 (1.39%) T-SQL
12 3 (1.05%) Perl
12 3 (1.05%) PHP
13 2 (0.70%) Data Analysis Expressions
13 2 (0.70%) Shell Script
14 1 (0.35%) Korn
14 1 (0.35%) VBA
Qualifications
1 48 (16.72%) Security Cleared
2 33 (11.50%) SC Cleared
3 25 (8.71%) Degree
4 20 (6.97%) Azure Certification
5 13 (4.53%) BPSS Clearance
6 10 (3.48%) CISSP
7 9 (3.14%) Microsoft Certification
8 8 (2.79%) CISM
9 7 (2.44%) Computer Science Degree
10 6 (2.09%) AWS Certification
11 5 (1.74%) Cisco Certification
12 4 (1.39%) CCNP
13 3 (1.05%) CCDP
13 3 (1.05%) MCP
13 3 (1.05%) PMI Certification
14 2 (0.70%) AWS Certified DevOps Engineer
14 2 (0.70%) CBAP
14 2 (0.70%) GCIA
14 2 (0.70%) GCIH
14 2 (0.70%) PMP
Quality Assurance & Compliance
1 22 (7.67%) QA
2 21 (7.32%) Accessibility
3 15 (5.23%) ISO 20022
4 14 (4.88%) NIST
5 13 (4.53%) Data Quality
6 11 (3.83%) GDPR
6 11 (3.83%) ISO/IEC 27001
6 11 (3.83%) PSD2
7 8 (2.79%) SEPA
8 7 (2.44%) PCI DSS
9 2 (0.70%) California Consumer Privacy Act
10 1 (0.35%) Cyber Essentials
10 1 (0.35%) GRC
10 1 (0.35%) HIPAA
10 1 (0.35%) NCSC
10 1 (0.35%) Sarbanes-Oxley
10 1 (0.35%) SOC 1
10 1 (0.35%) WCAG
System Software
1 50 (17.42%) Docker
2 47 (16.38%) Active Directory
3 9 (3.14%) VMware Infrastructure
4 5 (1.74%) vSphere
5 2 (0.70%) Virtual Desktop
5 2 (0.70%) Virtual Machines
5 2 (0.70%) Virtual Servers
6 1 (0.35%) Hyper-V
Systems Management
1 52 (18.12%) Kubernetes
2 38 (13.24%) Terraform
3 26 (9.06%) Microsoft Intune
4 15 (5.23%) SCCM
5 9 (3.14%) Ansible
6 6 (2.09%) Grafana
6 6 (2.09%) Prometheus
6 6 (2.09%) Single Sign-On
7 5 (1.74%) Fluentd
8 3 (1.05%) Active Directory Federation Services
8 3 (1.05%) Istio
8 3 (1.05%) Jamf Pro
9 2 (0.70%) Microsoft Clustering
10 1 (0.35%) AirWatch
10 1 (0.35%) QRadar
10 1 (0.35%) vCenter Server
Vendors
1 104 (36.24%) Microsoft
2 23 (8.01%) Google
2 23 (8.01%) ServiceNow
3 14 (4.88%) Oracle
4 12 (4.18%) VMware
5 11 (3.83%) F5
6 10 (3.48%) Cisco
7 9 (3.14%) Virgin Media
8 8 (2.79%) Databricks
9 7 (2.44%) Citrix
9 7 (2.44%) Palo Alto
9 7 (2.44%) Pega
9 7 (2.44%) Zscaler
10 6 (2.09%) IBM
10 6 (2.09%) Meraki
10 6 (2.09%) SolarWinds
11 5 (1.74%) Cribl.io
11 5 (1.74%) SAP
11 5 (1.74%) Splunk
12 4 (1.39%) Checkmarx