Mentoring Contract Job Trends in the North of England

Mentorship
England > North of England

The table below provides summary statistics and contractor rates for jobs advertised in the North of England requiring Mentoring skills. It covers vacancies from the 6 months leading up to 29 September 2025, with comparisons to the same periods in the previous two years.

6 months to
29 Sep 2025
Same period 2024 Same period 2023
Rank 49 46 83
Rank change year-on-year -3 +37 -4
Contract jobs citing Mentoring 182 162 128
As % of all contract jobs advertised in the North of England 4.60% 3.95% 2.49%
As % of the Processes & Methodologies category 5.17% 4.68% 2.82%
Number of daily rates quoted 129 85 92
10th Percentile £360 £294 £363
25th Percentile £438 £356 £393
Median daily rate (50th Percentile) £500 £493 £550
Median % change year-on-year +1.42% -10.36% +6.80%
75th Percentile £583 £560 £623
90th Percentile £688 £695 £749
England median daily rate £525 £573 £575
% change year-on-year -8.30% -0.43% -4.17%
Number of hourly rates quoted 5 4 4
10th Percentile £44.16 £43.85 £57.78
25th Percentile £47.50 £45.88 £66.44
Median hourly rate £62.50 £49.00 £76.25
Median % change year-on-year +27.55% -35.74% +1.67%
75th Percentile £65.00 £55.75 £82.73
90th Percentile £70.25 £64.30 £83.13
England median hourly rate £68.50 £57.50 £56.49
% change year-on-year +19.13% +1.79% -1.33%

All Process and Methodology Skills
North of England

Mentoring falls under the Processes and Methodologies category. For comparison with the information above, the following table provides summary statistics for all contract job vacancies requiring process or methodology skills in the North of England.

Contract vacancies with a requirement for process or methodology skills 3,518 3,458 4,543
As % of all contract IT jobs advertised in the North of England 88.86% 84.26% 88.25%
Number of daily rates quoted 2,305 1,925 3,026
10th Percentile £263 £300 £275
25th Percentile £375 £400 £400
Median daily rate (50th Percentile) £470 £500 £500
Median % change year-on-year -6.00% - -
75th Percentile £575 £580 £600
90th Percentile £672 £675 £675
England median daily rate £510 £525 £550
% change year-on-year -2.86% -4.55% -
Number of hourly rates quoted 201 179 205
10th Percentile £14.13 £13.75 £15.75
25th Percentile £17.44 £16.68 £17.72
Median hourly rate £22.63 £35.00 £27.50
Median % change year-on-year -35.34% +27.27% +37.50%
75th Percentile £36.75 £51.91 £46.18
90th Percentile £65.00 £70.00 £63.45
England median hourly rate £25.15 £43.00 £44.50
% change year-on-year -41.51% -3.37% +50.85%

Mentoring
Job Vacancy Trend in the North of England

Job postings citing Mentoring as a proportion of all IT jobs advertised in the North of England.
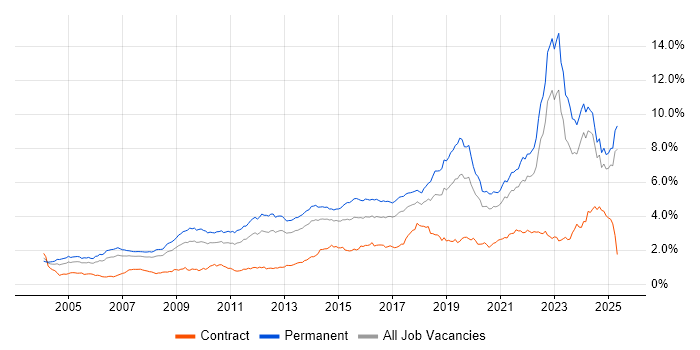
Job vacancy trend for Mentoring in the North of England

Mentoring
Daily Rate Trend in the North of England

Contractor daily rate distribution trend for jobs in the North of England citing Mentoring.

Contractor daily rate distribution trend for jobs in the North of England citing Mentoring

Mentoring
Daily Rate Histogram in the North of England

Daily rate distribution for jobs citing Mentoring in the North of England over the 6 months to 29 September 2025.

Daily rate histogram for Mentoring in the North of England

Mentoring
Hourly Rate Trend in the North of England

Contractor hourly rate distribution trend for jobs in the North of England citing Mentoring.

Contractor hourly rate distribution trend for jobs in the North of England citing Mentoring

Mentoring
Hourly Rate Histogram in the North of England

Hourly rate distribution of jobs citing Mentoring in the North of England over the 6 months to 29 September 2025.

Hourly rate histogram for Mentoring in the North of England

Mentoring
Contract Job Locations in the North of England

The table below looks at the demand and provides a guide to the median contractor rates quoted in IT jobs citing Mentoring within the North of England region over the 6 months to 29 September 2025. The 'Rank Change' column provides an indication of the change in demand within each location based on the same 6 month period last year.

Location Rank Change
on Same Period
Last Year
Matching
Contract
IT Job Ads
Median
Daily Rate
Past 6 Months
Median Daily Rate
% Change
on Same Period
Last Year
Live
Jobs
North West -10 93 £475 +11.76% 321
Yorkshire -11 76 £525 -7.28% 190
North East +2 15 £550 +3.87% 84
Mentoring
England

Mentoring
Co-occurring Skills and Capabilities in the North of England by Category

The follow tables expand on the table above by listing co-occurrences grouped by category. The same employment type, locality and period is covered with up to 20 co-occurrences shown in each of the following categories:

Application Platforms
1 5 (2.75%) Confluence
2 4 (2.20%) WebSphere
3 3 (1.65%) SharePoint
4 2 (1.10%) Apache Airflow
4 2 (1.10%) Apache Spark
4 2 (1.10%) CICS
4 2 (1.10%) Microsoft Exchange
4 2 (1.10%) WebSphere Application Server
5 1 (0.55%) JBoss
5 1 (0.55%) Mule
5 1 (0.55%) Mule ESB
5 1 (0.55%) Tomcat
5 1 (0.55%) WebLogic
Applications
1 10 (5.49%) Siemens NX
2 2 (1.10%) Microsoft PowerPoint
2 2 (1.10%) MS Visio
3 1 (0.55%) Chatbot
3 1 (0.55%) Microsoft Excel
Business Applications
1 10 (5.49%) Teamcenter
2 2 (1.10%) Kondor
3 1 (0.55%) SAP IBP
Cloud Services
1 57 (31.32%) AWS
2 41 (22.53%) Azure
3 26 (14.29%) GCP
4 16 (8.79%) Serverless
5 14 (7.69%) AWS Lambda
6 13 (7.14%) GitHub
7 10 (5.49%) Amazon EC2
7 10 (5.49%) Amazon ECS
8 9 (4.95%) Amazon CloudWatch
8 9 (4.95%) Amazon SQS
8 9 (4.95%) SaaS
9 8 (4.40%) Amazon S3
9 8 (4.40%) AWS Step Functions
9 8 (4.40%) GitHub Actions
10 7 (3.85%) Amazon EventBridge
10 7 (3.85%) Datadog
11 6 (3.30%) Amazon EKS
12 5 (2.75%) Amazon EMR
12 5 (2.75%) Apigee
12 5 (2.75%) PaaS
Communications & Networking
1 6 (3.30%) DNS
1 6 (3.30%) VPN
2 5 (2.75%) Firewall
2 5 (2.75%) TCP/IP
3 3 (1.65%) HTTPS
3 3 (1.65%) Network Security
4 2 (1.10%) Calico
4 2 (1.10%) iSCSI
4 2 (1.10%) LAN
4 2 (1.10%) SAN
4 2 (1.10%) SSL
4 2 (1.10%) VLAN
4 2 (1.10%) X.509
5 1 (0.55%) Ethernet
5 1 (0.55%) F5 BIG-IP LTM
5 1 (0.55%) HTTP
5 1 (0.55%) Intrusion Detection
5 1 (0.55%) tcpdump
5 1 (0.55%) Wireshark
Database & Business Intelligence
1 17 (9.34%) MongoDB
1 17 (9.34%) NoSQL
2 14 (7.69%) PostgreSQL
3 9 (4.95%) DynamoDB
4 7 (3.85%) Amazon Aurora
5 6 (3.30%) Amazon RDS
5 6 (3.30%) BigQuery
5 6 (3.30%) MySQL
5 6 (3.30%) Redis
6 5 (2.75%) Big Data
6 5 (2.75%) Data Warehouse
6 5 (2.75%) RDBMS
6 5 (2.75%) Relational Database
7 4 (2.20%) Amazon Redshift
7 4 (2.20%) Oracle Reports
8 3 (1.65%) Amazon Athena
8 3 (1.65%) Hadoop
9 2 (1.10%) DocumentDB
9 2 (1.10%) Looker
9 2 (1.10%) Power BI
Development Applications
1 30 (16.48%) Jenkins
2 21 (11.54%) Git
3 20 (10.99%) JIRA
4 17 (9.34%) GitLab
5 9 (4.95%) Maven
6 8 (4.40%) SonarQube
7 6 (3.30%) Selenium
8 5 (2.75%) Gradle
9 4 (2.20%) Cucumber
9 4 (2.20%) SonarLint
10 3 (1.65%) Artifactory
10 3 (1.65%) Cypress.io
10 3 (1.65%) JMeter
10 3 (1.65%) Oracle Forms
10 3 (1.65%) Postman
10 3 (1.65%) REST Assured
10 3 (1.65%) Sonatype Nexus
11 2 (1.10%) JUnit
11 2 (1.10%) SpecFlow
11 2 (1.10%) TestNG
General
1 52 (28.57%) Social Skills
2 45 (24.73%) Analytical Skills
3 36 (19.78%) Public Sector
4 31 (17.03%) Finance
5 17 (9.34%) Manufacturing
6 13 (7.14%) Banking
7 12 (6.59%) Aerospace
8 6 (3.30%) Influencing Skills
9 5 (2.75%) Inclusion and Diversity
9 5 (2.75%) Military
9 5 (2.75%) Presentation Skills
10 3 (1.65%) Documentation Skills
10 3 (1.65%) Marketing
11 2 (1.10%) Automotive
11 2 (1.10%) Electronics
11 2 (1.10%) General Ledger
11 2 (1.10%) Retail Banking
12 1 (0.55%) Law
12 1 (0.55%) Legal
12 1 (0.55%) Local Government
Job Titles
1 34 (18.68%) Lead
2 33 (18.13%) Architect
3 25 (13.74%) Developer
4 24 (13.19%) Senior
5 21 (11.54%) Software Engineer
6 12 (6.59%) Incident Manager
6 12 (6.59%) Technical Architect
7 11 (6.04%) Lead Software Engineer
8 8 (4.40%) DevOps Engineer
9 7 (3.85%) Technical Leader
10 6 (3.30%) Analyst
10 6 (3.30%) Java Architect
10 6 (3.30%) Java Technical Architect
10 6 (3.30%) Senior Developer
10 6 (3.30%) Support Manager
11 5 (2.75%) Android Developer
11 5 (2.75%) Senior DevOps
12 4 (2.20%) AWS Engineer
12 4 (2.20%) Platform Engineer
12 4 (2.20%) Senior DevOps Engineer
Libraries, Frameworks & Software Standards
1 18 (9.89%) Kafka
2 15 (8.24%) RESTful
3 13 (7.14%) Spring Boot
4 8 (4.40%) .NET
5 7 (3.85%) Celery
5 7 (3.85%) GraphQL
5 7 (3.85%) J2EE
5 7 (3.85%) Playwright
5 7 (3.85%) Spring
6 5 (2.75%) Django
6 5 (2.75%) FastAPI
6 5 (2.75%) Flask
6 5 (2.75%) JWT
6 5 (2.75%) Node.js
6 5 (2.75%) OAuth
6 5 (2.75%) pytest
6 5 (2.75%) RabbitMQ
7 4 (2.20%) JSON
7 4 (2.20%) Web Services
7 4 (2.20%) XML
Miscellaneous
1 15 (8.24%) Product Ownership
2 12 (6.59%) Analytical Mindset
3 8 (4.40%) Cloud Native
4 7 (3.85%) Data Protection Act
4 7 (3.85%) Onboarding
5 6 (3.30%) Mobile App
5 6 (3.30%) PKI
6 5 (2.75%) Algorithms
7 4 (2.20%) Data Structures
7 4 (2.20%) Management Information System
7 4 (2.20%) N-Tier
8 3 (1.65%) SCADA
8 3 (1.65%) Taxonomies
9 2 (1.10%) Clustering
9 2 (1.10%) Cyber Threat
9 2 (1.10%) Freedom of Information
9 2 (1.10%) Mainframe
9 2 (1.10%) Public Cloud
9 2 (1.10%) Replication
9 2 (1.10%) VSAM
Operating Systems
1 12 (6.59%) Windows
2 8 (4.40%) Linux
2 8 (4.40%) Unix
3 7 (3.85%) Android
4 6 (3.30%) Apple iOS
4 6 (3.30%) Windows Server
5 2 (1.10%) Windows 10
5 2 (1.10%) Windows 8
5 2 (1.10%) Windows Server 2003
5 2 (1.10%) Windows Server 2008
5 2 (1.10%) Windows Server 2012
5 2 (1.10%) Windows Server 2016
5 2 (1.10%) Windows XP
6 1 (0.55%) Mac OS
Processes & Methodologies
1 67 (36.81%) Agile
2 54 (29.67%) Coaching
3 53 (29.12%) CI/CD
4 48 (26.37%) Problem-Solving
5 37 (20.33%) Technical Leadership
6 35 (19.23%) DevOps
6 35 (19.23%) Microservices
7 30 (16.48%) Software Engineering
8 28 (15.38%) Stakeholder Management
9 23 (12.64%) Continuous Improvement
10 21 (11.54%) Test Automation
11 20 (10.99%) Containerisation
11 20 (10.99%) TDD
12 19 (10.44%) Clean Code
12 19 (10.44%) Infrastructure as Code
12 19 (10.44%) Roadmaps
13 17 (9.34%) Decision-Making
13 17 (9.34%) Incident Response
14 16 (8.79%) Visualisation
15 15 (8.24%) Artificial Intelligence
Programming Languages
1 40 (21.98%) Python
2 38 (20.88%) Java
3 13 (7.14%) SQL
4 12 (6.59%) JavaScript
5 11 (6.04%) PowerShell
6 10 (5.49%) Bash
7 8 (4.40%) Kotlin
8 6 (3.30%) Swift
9 5 (2.75%) C#
9 5 (2.75%) TypeScript
10 3 (1.65%) Objective-C
10 3 (1.65%) Search Processing Language
11 2 (1.10%) COBOL
11 2 (1.10%) JCL
11 2 (1.10%) REXX
11 2 (1.10%) Shell Script
12 1 (0.55%) C++
12 1 (0.55%) PHP
12 1 (0.55%) PL/SQL
12 1 (0.55%) VBScript
Qualifications
1 48 (26.37%) Security Cleared
2 31 (17.03%) SC Cleared
3 16 (8.79%) Degree
4 8 (4.40%) Computer Science Degree
5 7 (3.85%) AWS Certification
5 7 (3.85%) BPSS Clearance
6 5 (2.75%) Master's Degree
7 4 (2.20%) Azure Certification
7 4 (2.20%) Microsoft Certification
8 3 (1.65%) CISSP
9 2 (1.10%) AWS Certified Solutions Architect
9 2 (1.10%) Cisco Certification
9 2 (1.10%) CISM
9 2 (1.10%) DV Cleared
10 1 (0.55%) (ISC)2 CCSP
10 1 (0.55%) BC Cleared
10 1 (0.55%) CompTIA Security+
10 1 (0.55%) ISO 27001 Lead Implementer
10 1 (0.55%) TOGAF Certification
10 1 (0.55%) VCAP
Quality Assurance & Compliance
1 17 (9.34%) GDPR
2 12 (6.59%) Sarbanes-Oxley
3 10 (5.49%) QA
4 7 (3.85%) Accessibility
5 6 (3.30%) Data Quality
6 4 (2.20%) WCAG
7 3 (1.65%) HIPAA
7 3 (1.65%) SOC 2
8 2 (1.10%) Actionable Recommendations
8 2 (1.10%) ISO/IEC 27001
8 2 (1.10%) NCSC
8 2 (1.10%) NIST
9 1 (0.55%) AUTOSAR
9 1 (0.55%) Cyber Essentials
9 1 (0.55%) IEC 61131
9 1 (0.55%) PCI DSS
9 1 (0.55%) SOC 1
System Software
1 35 (19.23%) Docker
2 7 (3.85%) Active Directory
3 3 (1.65%) Virtual Servers
3 3 (1.65%) VMware Infrastructure
4 2 (1.10%) vSphere
5 1 (0.55%) Hyper-V
5 1 (0.55%) Microsoft App-V
5 1 (0.55%) Virtual Machines
5 1 (0.55%) VMware ESXi
5 1 (0.55%) VMware NSX
Systems Management
1 36 (19.78%) Terraform
2 24 (13.19%) Kubernetes
3 11 (6.04%) Ansible
4 5 (2.75%) Single Sign-On
5 4 (2.20%) SCCM
6 2 (1.10%) Control-M
6 2 (1.10%) Istio
6 2 (1.10%) Microsoft Intune
7 1 (0.55%) Grafana
7 1 (0.55%) MOM
7 1 (0.55%) Nessus
7 1 (0.55%) OpenVAS
7 1 (0.55%) Packer
7 1 (0.55%) PowerCLI
7 1 (0.55%) Progress Chef
7 1 (0.55%) Prometheus
7 1 (0.55%) QRadar
7 1 (0.55%) vCenter Server
7 1 (0.55%) Wonderware InTouch
Vendors
1 21 (11.54%) ServiceNow
2 18 (9.89%) Microsoft
3 10 (5.49%) Oracle
3 10 (5.49%) Siemens
4 6 (3.30%) Google
5 5 (2.75%) Gigya
5 5 (2.75%) Splunk
6 4 (2.20%) F5
6 4 (2.20%) IBM
6 4 (2.20%) Palo Alto
6 4 (2.20%) VMware
7 3 (1.65%) Atlassian
7 3 (1.65%) CheckPoint
7 3 (1.65%) Cisco
7 3 (1.65%) ForgeRock
7 3 (1.65%) Ping Identity
7 3 (1.65%) SAP
7 3 (1.65%) Veeam
8 2 (1.10%) Parasoft
8 2 (1.10%) SolarWinds