Mentoring Jobs in the North of England

Mentorship
England > North of England

The following table provides summary statistics for permanent job vacancies advertised in the North of England with a requirement for Mentoring skills. Included is a benchmarking guide to the salaries offered in vacancies that have cited Mentoring over the 6 months to 7 December 2023 with a comparison to the same period in the previous 2 years.

6 months to
7 Dec 2023
Same period 2022 Same period 2021
Rank 30 20 28
Rank change year-on-year -10 +8 +19
Permanent jobs citing Mentoring 638 1,923 1,232
As % of all permanent jobs advertised in the North of England 8.29% 11.33% 7.42%
As % of the Processes & Methodologies category 8.71% 11.79% 7.79%
Number of salaries quoted 420 778 872
10th Percentile £36,250 £31,250 £31,250
25th Percentile £46,250 £45,000 £38,750
Median annual salary (50th Percentile) £62,500 £60,000 £52,500
Median % change year-on-year +4.17% +14.29% +5.00%
75th Percentile £75,000 £72,500 £67,500
90th Percentile £91,934 £85,000 £78,625
England median annual salary £67,500 £67,500 £65,000
% change year-on-year - +3.85% +4.00%

All Process and Methodology Skills
North of England

Mentoring is in the Processes and Methodologies category. The following table is for comparison with the above and provides summary statistics for all permanent job vacancies advertised in the North of England with a requirement for process or methodology skills.

Permanent vacancies with a requirement for process or methodology skills 7,327 16,316 15,814
As % of all permanent jobs advertised in the North of England 95.16% 96.12% 95.20%
Number of salaries quoted 5,109 9,291 11,595
10th Percentile £29,750 £31,000 £30,000
25th Percentile £41,000 £40,351 £37,500
Median annual salary (50th Percentile) £54,000 £52,500 £50,000
Median % change year-on-year +2.86% +5.00% +5.26%
75th Percentile £68,750 £70,000 £65,000
90th Percentile £83,750 £85,000 £77,500
England median annual salary £60,000 £62,500 £60,000
% change year-on-year -4.00% +4.17% +9.09%

Mentoring
Job Vacancy Trend in the North of England

Job postings citing Mentoring as a proportion of all IT jobs advertised in the North of England.
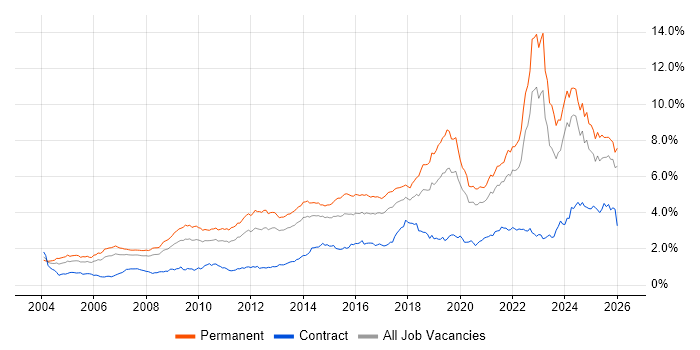
Job vacancy trend for Mentoring in the North of England

Mentoring
Salary Trend in the North of England

3-month moving average salary quoted in jobs citing Mentoring in the North of England.

Salary trend for Mentoring in the North of England

Mentoring
Salary Histogram in the North of England

Salary distribution for jobs citing Mentoring in the North of England over the 6 months to 7 December 2023.

Salary histogram for Mentoring in the North of England

Mentoring
Job Locations in the North of England

The table below looks at the demand and provides a guide to the median salaries quoted in IT jobs citing Mentoring within the North of England region over the 6 months to 7 December 2023. The 'Rank Change' column provides an indication of the change in demand within each location based on the same 6 month period last year.

Location Rank Change
on Same Period
Last Year
Matching
Permanent
IT Job Ads
Median Salary
Past 6 Months
Median Salary
% Change
on Same Period
Last Year
Live
Jobs
North West -6 348 £57,291 -0.36% 257
Yorkshire -7 260 £65,925 +1.42% 163
North East +8 30 £65,000 +17.12% 79
Mentoring
England

Mentoring
Co-occurring Skills and Capabilities in the North of England by Category

The follow tables expand on the table above by listing co-occurrences grouped by category. The same employment type, locality and period is covered with up to 20 co-occurrences shown in each of the following categories:

Application Platforms
1 24 (3.76%) Confluence
2 22 (3.45%) JBoss
2 22 (3.45%) Red Hat Fuse
3 9 (1.41%) IIS
4 6 (0.94%) SharePoint
4 6 (0.94%) Tomcat
5 4 (0.63%) CMS
5 4 (0.63%) WebSphere
5 4 (0.63%) WebSphere Application Server
6 3 (0.47%) Apache
6 3 (0.47%) Apache Airflow
6 3 (0.47%) NServiceBus
7 2 (0.31%) nginx
7 2 (0.31%) SAS
7 2 (0.31%) Sitecore CMS
8 1 (0.16%) Adobe Experience Manager
8 1 (0.16%) Apache Spark
8 1 (0.16%) WordPress
Applications
1 14 (2.19%) Microsoft Excel
2 9 (1.41%) Microsoft Office
3 5 (0.78%) Trello
4 1 (0.16%) MS Visio
Business Applications
1 3 (0.47%) Dynamics CRM
2 2 (0.31%) Magento
2 2 (0.31%) Oracle ERP
2 2 (0.31%) Remedy ITSM
Cloud Services
1 222 (34.80%) Azure
2 123 (19.28%) AWS
3 108 (16.93%) GCP
4 83 (13.01%) Power Platform
5 64 (10.03%) Azure DevOps
5 64 (10.03%) Serverless
6 48 (7.52%) Dynamics 365
7 37 (5.80%) Microsoft 365
8 22 (3.45%) SaaS
9 18 (2.82%) PaaS
10 16 (2.51%) GitHub
10 16 (2.51%) IaaS
11 9 (1.41%) Azure Sentinel
11 9 (1.41%) OpenShift
12 8 (1.25%) dbt
13 6 (0.94%) AWS CodePipeline
13 6 (0.94%) AWS Lambda
13 6 (0.94%) Azure ExpressRoute
13 6 (0.94%) Cloud Computing
14 5 (0.78%) Amazon EC2
Communications & Networking
1 12 (1.88%) LAN
1 12 (1.88%) SAN
2 11 (1.72%) DNS
2 11 (1.72%) Firewall
3 10 (1.57%) Network Security
3 10 (1.57%) TCP/IP
4 9 (1.41%) WAN
5 8 (1.25%) Structured Cabling
6 7 (1.10%) Unified Communications
6 7 (1.10%) Wireless
7 6 (0.94%) Internet
8 4 (0.63%) DHCP
8 4 (0.63%) SSL
8 4 (0.63%) Wi-Fi
9 3 (0.47%) Cisco ISE
9 3 (0.47%) HTTP
9 3 (0.47%) NGFW
10 2 (0.31%) Cisco Firepower
10 2 (0.31%) DMZ
10 2 (0.31%) NetScaler
Database & Business Intelligence
1 53 (8.31%) SQL Server
2 33 (5.17%) Power BI
3 26 (4.08%) MySQL
4 25 (3.92%) PostgreSQL
5 11 (1.72%) Big Data
6 10 (1.57%) Data Warehouse
6 10 (1.57%) MongoDB
7 9 (1.41%) Data Lake
7 9 (1.41%) SQL Server Analysis Services
7 9 (1.41%) SQL Server Integration Services
8 7 (1.10%) Amazon RDS
8 7 (1.10%) Elasticsearch
8 7 (1.10%) Tableau
9 6 (0.94%) BigQuery
9 6 (0.94%) DataStage
9 6 (0.94%) IBM InfoSphere
10 5 (0.78%) Azure SQL Database
10 5 (0.78%) Relational Database
10 5 (0.78%) SQL Server Reporting Services
11 4 (0.63%) BusinessObjects Business Intelligence
Development Applications
1 105 (16.46%) Git
2 45 (7.05%) Jenkins
3 40 (6.27%) JIRA
4 22 (3.45%) IntelliJ
5 20 (3.13%) Spinnaker
6 12 (1.88%) IBM UrbanCode
7 11 (1.72%) Bitbucket
8 10 (1.57%) Gradle
8 10 (1.57%) SonarQube
8 10 (1.57%) Sonatype Nexus
9 9 (1.41%) Maven
9 9 (1.41%) Selenium
10 8 (1.25%) Artifactory
10 8 (1.25%) Cucumber
11 7 (1.10%) Ant
11 7 (1.10%) Mocha
11 7 (1.10%) Zephyr
12 4 (0.63%) GDB
12 4 (0.63%) Oracle APEX
13 3 (0.47%) NUnit
General
1 212 (33.23%) Finance
2 187 (29.31%) Social Skills
3 99 (15.52%) Banking
4 62 (9.72%) Analytical Skills
5 60 (9.40%) Retail
6 54 (8.46%) Inclusion and Diversity
7 42 (6.58%) Public Sector
8 29 (4.55%) Police
9 24 (3.76%) Law
9 24 (3.76%) Presentation Skills
10 19 (2.98%) Marketing
10 19 (2.98%) Organisational Skills
10 19 (2.98%) Tech for Good
11 9 (1.41%) Influencing Skills
12 8 (1.25%) Manufacturing
13 7 (1.10%) Legal
14 6 (0.94%) Games
15 5 (0.78%) Electronics
15 5 (0.78%) Telecoms
16 4 (0.63%) Advertising
Job Titles
1 146 (22.88%) Senior
2 107 (16.77%) Software Engineer
3 106 (16.61%) Lead
4 102 (15.99%) Developer
5 92 (14.42%) Architect
6 61 (9.56%) Analyst
7 58 (9.09%) Solutions Architect
8 56 (8.78%) Java Engineer
9 54 (8.46%) Java Software Engineer
10 53 (8.31%) Senior Developer
11 46 (7.21%) Dynamics 365 Architect
12 40 (6.27%) DevOps Engineer
13 39 (6.11%) Senior Software Engineer
14 36 (5.64%) Dynamics 365 Solution Architect
15 27 (4.23%) Java Developer
16 22 (3.45%) Team Leader
17 20 (3.13%) .NET Developer
18 18 (2.82%) Senior Analyst
19 17 (2.66%) Graduate
19 17 (2.66%) Support Engineer
Libraries, Frameworks & Software Standards
1 89 (13.95%) React
2 84 (13.17%) .NET
3 77 (12.07%) Spring
4 55 (8.62%) AngularJS
5 40 (6.27%) HTML
6 39 (6.11%) J2EE
6 39 (6.11%) Node.js
7 38 (5.96%) Ruby on Rails
8 35 (5.49%) Web Services
9 33 (5.17%) CSS
10 28 (4.39%) REST
11 27 (4.23%) .NET Framework
11 27 (4.23%) RESTful
11 27 (4.23%) SOAP
12 23 (3.61%) .NET Core
12 23 (3.61%) JSON
12 23 (3.61%) XML
13 22 (3.45%) Hibernate
13 22 (3.45%) JPA
13 22 (3.45%) XSD
Miscellaneous
1 74 (11.60%) Product Ownership
2 42 (6.58%) Public Cloud
3 29 (4.55%) Cyberattack
3 29 (4.55%) Self-Motivation
4 23 (3.61%) Linux Command Line
5 16 (2.51%) Greenfield Project
6 14 (2.19%) Cloud Native
6 14 (2.19%) Management Information System
6 14 (2.19%) Private Cloud
7 13 (2.04%) Analytical Mindset
7 13 (2.04%) Virtual Team
8 12 (1.88%) Video Conferencing
9 10 (1.57%) Onboarding
10 9 (1.41%) Mobile App
10 9 (1.41%) Security Posture
11 8 (1.25%) Credit Risk
12 7 (1.10%) Data Protection Act
12 7 (1.10%) Digital Signage
12 7 (1.10%) Embedded Systems
12 7 (1.10%) Legacy Systems
Operating Systems
1 72 (11.29%) Linux
2 69 (10.82%) Windows
3 25 (3.92%) Windows Server
4 18 (2.82%) Unix
5 17 (2.66%) Windows Server 2012
6 16 (2.51%) Windows 10
7 10 (1.57%) Windows Server 2019
8 4 (0.63%) Windows Vista
9 3 (0.47%) Android
9 3 (0.47%) CoreOS
9 3 (0.47%) zOS
10 2 (0.31%) Ubuntu
10 2 (0.31%) Windows Server 2016
11 1 (0.16%) Apple iOS
11 1 (0.16%) Debian
11 1 (0.16%) Mac OS
Processes & Methodologies
1 345 (54.08%) Agile
2 202 (31.66%) Coaching
3 163 (25.55%) Problem-Solving
4 157 (24.61%) DevOps
5 156 (24.45%) Software Engineering
6 135 (21.16%) Microservices
7 129 (20.22%) Actionable Insight
8 90 (14.11%) CI/CD
9 87 (13.64%) Containerisation
10 75 (11.76%) Code Quality
11 74 (11.60%) User Experience
12 68 (10.66%) Continuous Integration
13 61 (9.56%) Unit Testing
14 60 (9.40%) Line Management
15 59 (9.25%) Software Delivery
16 58 (9.09%) Project Management
17 55 (8.62%) Scrum
17 55 (8.62%) Technical Leadership
18 54 (8.46%) Analytics
18 54 (8.46%) Design Patterns
Programming Languages
1 167 (26.18%) Java
2 104 (16.30%) Python
3 93 (14.58%) C#
4 91 (14.26%) JavaScript
5 59 (9.25%) SQL
6 41 (6.43%) Ruby
6 41 (6.43%) TypeScript
7 37 (5.80%) Go
8 24 (3.76%) PowerShell
8 24 (3.76%) Rust
9 20 (3.13%) PHP
10 16 (2.51%) Bash
11 12 (1.88%) T-SQL
12 11 (1.72%) C++
13 10 (1.57%) C
13 10 (1.57%) Groovy
14 6 (0.94%) Bicep
14 6 (0.94%) Scala
15 4 (0.63%) Kusto Query Language
15 4 (0.63%) PL/SQL
Qualifications
1 116 (18.18%) Security Cleared
2 106 (16.61%) Degree
3 83 (13.01%) SC Cleared
4 39 (6.11%) Computer Science Degree
5 31 (4.86%) DV Cleared
6 28 (4.39%) AWS Certification
7 23 (3.61%) AWS Certified Cloud Practitioner
7 23 (3.61%) AWS Certified Developer
7 23 (3.61%) AWS Certified Solutions Architect
8 10 (1.57%) ITIL Certification
8 10 (1.57%) Microsoft Certification
9 6 (0.94%) Master's Degree
10 5 (0.78%) Azure Certification
10 5 (0.78%) MCSE
11 4 (0.63%) Chartered Engineer
11 4 (0.63%) Cisco Certification
11 4 (0.63%) IIBA
11 4 (0.63%) ISTQB
12 3 (0.47%) PMI Certification
12 3 (0.47%) PMP
Quality Assurance & Compliance
1 55 (8.62%) QA
2 14 (2.19%) Cyber Essentials
3 11 (1.72%) SLA
4 7 (1.10%) PMO
5 6 (0.94%) Accessibility
5 6 (0.94%) Cyber Essentials PLUS
5 6 (0.94%) Data Quality
6 4 (0.63%) GMP
6 4 (0.63%) NIST
7 3 (0.47%) Actionable Recommendations
7 3 (0.47%) ISO/IEC 27001
8 2 (0.31%) COBIT
8 2 (0.31%) GDPR
8 2 (0.31%) GRC
8 2 (0.31%) NIST 800
8 2 (0.31%) PCI DSS
9 1 (0.16%) IFRS 17
9 1 (0.16%) NCSC
9 1 (0.16%) PSD2
9 1 (0.16%) WCAG
System Software
1 49 (7.68%) Docker
2 23 (3.61%) Active Directory
3 14 (2.19%) VMware Infrastructure
4 8 (1.25%) Virtual Servers
4 8 (1.25%) vSphere
5 7 (1.10%) Virtual Machines
6 6 (0.94%) Firmware
7 5 (0.78%) Embedded Firmware
7 5 (0.78%) Hyper-V
8 1 (0.16%) Snort
Systems Management
1 56 (8.78%) Kubernetes
2 48 (7.52%) Terraform
3 29 (4.55%) Ansible
4 13 (2.04%) Microsoft Intune
5 10 (1.57%) Prometheus
6 8 (1.25%) Nessus
7 7 (1.10%) Kibana
7 7 (1.10%) Nagios
7 7 (1.10%) Progress Chef
7 7 (1.10%) Puppet
8 3 (0.47%) CA Endevor
8 3 (0.47%) CSIRT
8 3 (0.47%) Grafana
8 3 (0.47%) MIIS
9 2 (0.31%) N-central
9 2 (0.31%) Single Sign-On
10 1 (0.16%) Packer
10 1 (0.16%) SCCM
Vendors
1 133 (20.85%) Microsoft
2 70 (10.97%) Google
3 23 (3.61%) Oracle
4 19 (2.98%) VMware
5 17 (2.66%) IBM
6 16 (2.51%) ServiceNow
7 12 (1.88%) Cisco
8 10 (1.57%) Splunk
9 9 (1.41%) Dynatrace
10 8 (1.25%) arcserve
10 8 (1.25%) Sophos
11 7 (1.10%) New Relic
11 7 (1.10%) Veracode
12 6 (0.94%) Confluent
13 5 (0.78%) Salesforce
14 4 (0.63%) Atlassian
14 4 (0.63%) Intel
15 3 (0.47%) Palo Alto
15 3 (0.47%) SAP
15 3 (0.47%) Sitecore