Windows Jobs in Cambridge

Microsoft Windows
Cambridgeshire > Cambridge

The following table provides summary statistics for permanent job vacancies advertised in Cambridge with a requirement for Windows skills. Included is a benchmarking guide to the salaries offered in vacancies that have cited Windows over the 6 months to 27 April 2024 with a comparison to the same period in the previous 2 years.

6 months to
27 Apr 2024
Same period 2023 Same period 2022
Rank 15 29 35
Rank change year-on-year +14 +6 -4
Permanent jobs citing Windows 119 90 126
As % of all permanent jobs advertised in Cambridge 12.07% 8.96% 7.74%
As % of the Operating Systems category 43.59% 41.10% 28.90%
Number of salaries quoted 89 49 80
10th Percentile £24,240 £27,400 £19,750
25th Percentile £30,000 £29,023 £27,500
Median annual salary (50th Percentile) £38,000 £35,000 £42,250
Median % change year-on-year +8.57% -17.16% +12.67%
75th Percentile £43,750 £45,000 £56,250
90th Percentile £53,750 £60,000 £67,750
Cambridgeshire median annual salary £37,500 £38,500 £42,250
% change year-on-year -2.60% -8.88% +2.42%

All Operating Systems
Cambridge

Windows is in the Operating Systems category. The following table is for comparison with the above and provides summary statistics for all permanent job vacancies advertised in Cambridge with a requirement for operating system skills.

Permanent vacancies with a requirement for operating system skills 273 219 436
As % of all permanent jobs advertised in Cambridge 27.69% 21.79% 26.78%
Number of salaries quoted 213 103 137
10th Percentile £27,750 £28,405 £26,500
25th Percentile £37,500 £33,625 £34,500
Median annual salary (50th Percentile) £47,500 £45,000 £50,000
Median % change year-on-year +5.56% -10.00% -4.76%
75th Percentile £67,500 £70,000 £70,000
90th Percentile £83,750 £87,000 £80,000
Cambridgeshire median annual salary £45,000 £45,000 £50,000
% change year-on-year - -10.00% -

Windows
Job Vacancy Trend in Cambridge

Job postings citing Windows as a proportion of all IT jobs advertised in Cambridge.
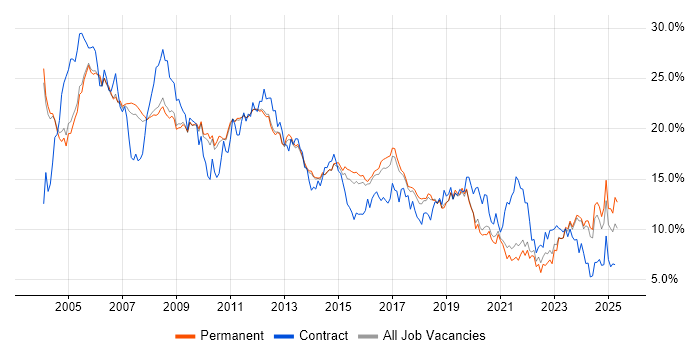
Job vacancy trend for Windows in Cambridge

Windows
Salary Trend in Cambridge

3-month moving average salary quoted in jobs citing Windows in Cambridge.

Salary trend for Windows in Cambridge

Windows
Salary Histogram in Cambridge

Salary distribution for jobs citing Windows in Cambridge over the 6 months to 27 April 2024.

Salary histogram for Windows in Cambridge

Windows
Co-occurring Skills and Capabilities in Cambridge by Category

The follow tables expand on the table above by listing co-occurrences grouped by category. The same employment type, locality and period is covered with up to 20 co-occurrences shown in each of the following categories:

Application Platforms
1 19 (15.97%) Microsoft Exchange
2 16 (13.45%) SharePoint
3 2 (1.68%) WordPress
Applications
1 3 (2.52%) Microsoft Office
Cloud Services
1 31 (26.05%) Microsoft 365
2 29 (24.37%) Azure
3 22 (18.49%) AWS
4 6 (5.04%) Serverless
5 3 (2.52%) Google Workspace
6 2 (1.68%) Cloud Computing
6 2 (1.68%) Entra ID
7 1 (0.84%) Power Platform
Communications & Networking
1 29 (24.37%) SAN
2 23 (19.33%) Firewall
3 16 (13.45%) Wi-Fi
4 11 (9.24%) DHCP
4 11 (9.24%) DNS
5 10 (8.40%) Bluetooth
6 9 (7.56%) TCP/IP
7 8 (6.72%) NAS
8 7 (5.88%) 3G
8 7 (5.88%) 4G
8 7 (5.88%) GPRS
8 7 (5.88%) GSM
8 7 (5.88%) LTE
8 7 (5.88%) VLAN
8 7 (5.88%) VPN
9 5 (4.20%) Remote Desktop
10 3 (2.52%) Intranet
11 2 (1.68%) IP Telephony
11 2 (1.68%) LAN
11 2 (1.68%) Wireless
Database & Business Intelligence
1 7 (5.88%) SQL Server
2 4 (3.36%) Amazon RDS
3 3 (2.52%) SQL Server Reporting Services
4 1 (0.84%) Power BI
4 1 (0.84%) SQL Server Integration Services
Development Applications
1 8 (6.72%) Appium
1 8 (6.72%) UI Automator
2 3 (2.52%) Git
3 1 (0.84%) Bugzilla
3 1 (0.84%) Jenkins
3 1 (0.84%) JIRA
General
1 45 (37.82%) Social Skills
2 13 (10.92%) Analytical Skills
3 10 (8.40%) Automotive
4 9 (7.56%) Finance
5 5 (4.20%) Manufacturing
6 4 (3.36%) Organisational Skills
7 3 (2.52%) Electronics
7 3 (2.52%) Public Sector
8 2 (1.68%) Inclusion and Diversity
8 2 (1.68%) Retail
8 2 (1.68%) Telecoms
9 1 (0.84%) Law
Job Titles
1 30 (25.21%) Support Engineer
2 29 (24.37%) Administrator
3 21 (17.65%) IT Administrator
3 21 (17.65%) Server Administrator
4 19 (15.97%) IT Support
5 14 (11.76%) IT Engineer
5 14 (11.76%) IT Support Engineer
6 13 (10.92%) IT Technician
6 13 (10.92%) Mobile Engineer
7 11 (9.24%) Technical Engineer
8 8 (6.72%) Junior
8 8 (6.72%) Test Engineer
9 7 (5.88%) Desktop Engineer
9 7 (5.88%) Desktop Support
9 7 (5.88%) Desktop Support Engineer
9 7 (5.88%) Junior Desktop Support
9 7 (5.88%) Junior Support Engineer
9 7 (5.88%) Linux Administrator
9 7 (5.88%) Technical Support
9 7 (5.88%) Technical Support Engineer
Libraries, Frameworks & Software Standards
1 2 (1.68%) iOS SDK
1 2 (1.68%) PyQt
1 2 (1.68%) scikit-learn
1 2 (1.68%) XML
2 1 (0.84%) Flask
2 1 (0.84%) RESTful
Miscellaneous
1 23 (19.33%) Self-Motivation
2 21 (17.65%) Data Centre
3 17 (14.29%) Driving Licence
4 8 (6.72%) Mobile App
5 6 (5.04%) iPad
5 6 (5.04%) Public Cloud
5 6 (5.04%) Smartphone
6 5 (4.20%) Client/Server
6 5 (4.20%) Embedded Systems
6 5 (4.20%) Life Science
6 5 (4.20%) Management Information System
7 2 (1.68%) IoT
7 2 (1.68%) NHS
7 2 (1.68%) Robotics
7 2 (1.68%) Team-Oriented Environment
8 1 (0.84%) Algorithms
8 1 (0.84%) e-Learning
8 1 (0.84%) FPGA
8 1 (0.84%) Greenfield Project
8 1 (0.84%) LIMS
Operating Systems
1 65 (54.62%) Linux
2 55 (46.22%) Windows Server
3 18 (15.13%) Mac OS
4 7 (5.88%) Unix
4 7 (5.88%) Windows 10
5 6 (5.04%) Apple iOS
5 6 (5.04%) Windows Server 2016
6 5 (4.20%) Windows Server 2019
7 4 (3.36%) Android
7 4 (3.36%) Mac OS X
8 3 (2.52%) Red Hat Enterprise Linux
9 2 (1.68%) Windows 7
10 1 (0.84%) Windows Server 2012
Processes & Methodologies
1 33 (27.73%) Problem-Solving
2 22 (18.49%) Server Management
3 21 (17.65%) Benchmarking
3 21 (17.65%) Data Centre Operations
3 21 (17.65%) Infrastructure Maintenance
3 21 (17.65%) Performance Monitoring
3 21 (17.65%) Vulnerability Management
4 16 (13.45%) Computer Science
5 14 (11.76%) Asset Management
5 14 (11.76%) Proactive Maintenance
6 11 (9.24%) Customer Service
7 10 (8.40%) Test Automation
8 9 (7.56%) Agile
9 8 (6.72%) Manual Testing
10 7 (5.88%) Mentoring
10 7 (5.88%) Software Engineering
11 6 (5.04%) Line Management
11 6 (5.04%) User Experience
12 5 (4.20%) Biotechnology
13 4 (3.36%) Project Management
Programming Languages
1 25 (21.01%) PowerShell
2 11 (9.24%) Python
3 5 (4.20%) SQL
4 4 (3.36%) Java
5 2 (1.68%) Bash
5 2 (1.68%) C
5 2 (1.68%) C#
5 2 (1.68%) JavaScript
5 2 (1.68%) Kotlin
5 2 (1.68%) Objective-C
5 2 (1.68%) Rust
5 2 (1.68%) T-SQL
6 1 (0.84%) C++
6 1 (0.84%) Embedded C
6 1 (0.84%) Perl
Qualifications
1 42 (35.29%) Security Cleared
2 29 (24.37%) Degree
3 21 (17.65%) SC Cleared
4 14 (11.76%) BPSS Clearance
4 14 (11.76%) Microsoft Certification
5 12 (10.08%) Computer Science Degree
6 7 (5.88%) CCNA
6 7 (5.88%) Cisco Certification
6 7 (5.88%) MCSE
7 6 (5.04%) MCSA
8 3 (2.52%) A+ Certification
8 3 (2.52%) DBS Check
8 3 (2.52%) Master's Degree
9 2 (1.68%) Azure Certification
9 2 (1.68%) Network+ Certification
9 2 (1.68%) PhD
10 1 (0.84%) AWS Certification
10 1 (0.84%) HNC
Quality Assurance & Compliance
1 15 (12.61%) SLA
2 14 (11.76%) PCI DSS
3 9 (7.56%) QA
4 4 (3.36%) GDPR
5 3 (2.52%) Cyber Essentials
6 2 (1.68%) Data Quality
System Software
1 47 (39.50%) Active Directory
2 25 (21.01%) VMware Infrastructure
3 19 (15.97%) Hyper-V
4 14 (11.76%) KVM
5 4 (3.36%) Virtual Desktop
6 3 (2.52%) VMware ESXi
7 1 (0.84%) Docker
7 1 (0.84%) Firmware
Systems Management
1 1 (0.84%) HP Quality Center
1 1 (0.84%) Jamf Pro
1 1 (0.84%) vCenter Server
Vendors
1 66 (55.46%) Microsoft
2 50 (42.02%) VMware
3 25 (21.01%) Citrix
4 21 (17.65%) NetApp
5 17 (14.29%) Dell
6 5 (4.20%) HP
6 5 (4.20%) Veeam
7 3 (2.52%) Draytek
7 3 (2.52%) Google
7 3 (2.52%) Red Hat
8 2 (1.68%) Acronis
8 2 (1.68%) Apple
8 2 (1.68%) ConnectWise
8 2 (1.68%) MikroTik
8 2 (1.68%) QNX
8 2 (1.68%) Ubiquiti
8 2 (1.68%) WatchGuard
9 1 (0.84%) Bloomberg
9 1 (0.84%) Cisco