Analytical Skills Jobs in Cambridge

Analytical Skills
Cambridgeshire > Cambridge

The table below looks at the prevalence of the term Analytical Skills in permanent job vacancies advertised in Cambridge. Included is a benchmarking guide to the salaries offered in vacancies that have cited Analytical Skills over the 6 months to 27 April 2024 with a comparison to the same period over the previous 2 years.

6 months to
27 Apr 2024
Same period 2023 Same period 2022
Rank 17 27 22
Rank change year-on-year +10 -5 +3
Permanent jobs citing Analytical Skills 105 96 164
As % of all permanent jobs advertised in Cambridge 10.65% 9.55% 10.07%
As % of the General category 19.59% 14.29% 16.89%
Number of salaries quoted 69 19 32
10th Percentile £33,800 £30,000 £32,000
25th Percentile £37,500 £30,500 £34,500
Median annual salary (50th Percentile) £55,000 £52,500 £47,500
Median % change year-on-year +4.76% +10.53% +18.75%
75th Percentile £57,500 £63,125 £49,250
90th Percentile £77,500 £75,000 £71,250
Cambridgeshire median annual salary £52,500 £30,000 £42,500
% change year-on-year +75.00% -29.41% +13.33%

All General Skills
Cambridge

Analytical Skills is in the General Skills category. The following table is for comparison with the above and provides summary statistics for all permanent job vacancies advertised in Cambridge with a requirement for common skills.

Permanent vacancies with a requirement for common skills 536 672 971
As % of all permanent jobs advertised in Cambridge 54.36% 66.87% 59.64%
Number of salaries quoted 413 221 301
10th Percentile £32,500 £29,023 £28,500
25th Percentile £38,000 £37,250 £36,250
Median annual salary (50th Percentile) £55,000 £52,500 £50,600
Median % change year-on-year +4.76% +3.75% -8.00%
75th Percentile £72,500 £67,500 £70,000
90th Percentile £80,001 £80,000 £82,500
Cambridgeshire median annual salary £50,000 £50,000 £49,000
% change year-on-year - +2.04% -5.77%

Analytical Skills
Job Vacancy Trend in Cambridge

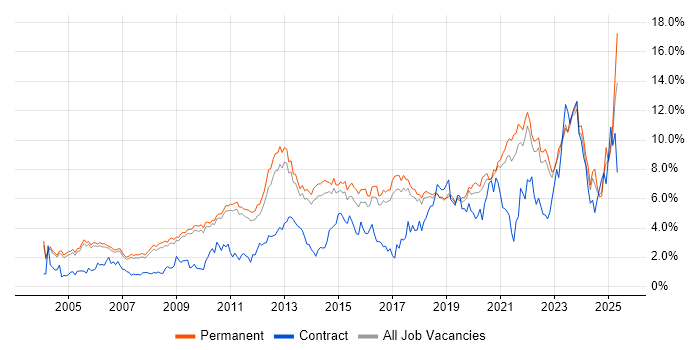
Job postings citing Analytical Skills as a proportion of all IT jobs advertised in Cambridge.

Job vacancy trend for Analytical Skills in Cambridge

Analytical Skills
Salary Trend in Cambridge

3-month moving average salary quoted in jobs citing Analytical Skills in Cambridge.

Salary trend for Analytical Skills in Cambridge

Analytical Skills
Salary Histogram in Cambridge

Salary distribution for jobs citing Analytical Skills in Cambridge over the 6 months to 27 April 2024.

Salary histogram for Analytical Skills in Cambridge

Analytical Skills
Co-occurring Skills and Capabilities in Cambridge by Category

The follow tables expand on the table above by listing co-occurrences grouped by category. The same employment type, locality and period is covered with up to 20 co-occurrences shown in each of the following categories:

Application Platforms
1 3 (2.86%) Apache
1 3 (2.86%) SharePoint
2 1 (0.95%) Confluence
Applications
1 7 (6.67%) Microsoft Excel
2 3 (2.86%) Spreadsheet
3 1 (0.95%) Microsoft Office
Business Applications
1 5 (4.76%) Oracle Financials
2 3 (2.86%) Salesforce CRM
Cloud Services
1 18 (17.14%) AWS
2 7 (6.67%) Azure
3 4 (3.81%) Amazon EMR
4 3 (2.86%) GCP
5 2 (1.90%) Microsoft 365
6 1 (0.95%) AWS Lambda
6 1 (0.95%) Dynamics 365
6 1 (0.95%) Google Sheets
6 1 (0.95%) Power Platform
6 1 (0.95%) SaaS
6 1 (0.95%) Serverless
Communications & Networking
1 32 (30.48%) TCP/IP
2 7 (6.67%) DHCP
2 7 (6.67%) DNS
2 7 (6.67%) Firewall
2 7 (6.67%) NAS
2 7 (6.67%) SAN
2 7 (6.67%) VLAN
3 4 (3.81%) Internet
4 3 (2.86%) 5G
4 3 (2.86%) Broadband
5 2 (1.90%) Intranet
Database & Business Intelligence
1 5 (4.76%) SQL Server
2 4 (3.81%) Amazon Redshift
2 4 (3.81%) PowerPivot
2 4 (3.81%) QlikView
2 4 (3.81%) Tableau
3 3 (2.86%) BigQuery
3 3 (2.86%) Looker
3 3 (2.86%) MongoDB
3 3 (2.86%) PostgreSQL
4 2 (1.90%) SQL Server Reporting Services
5 1 (0.95%) DynamoDB
5 1 (0.95%) Geospatial Data
5 1 (0.95%) GIS
5 1 (0.95%) Power BI
Development Applications
1 6 (5.71%) Git
2 2 (1.90%) Appium
2 2 (1.90%) GCC
2 2 (1.90%) UI Automator
3 1 (0.95%) JIRA
3 1 (0.95%) ScriptRunner
General
1 51 (48.57%) Social Skills
2 31 (29.52%) Electronics
3 23 (21.90%) Finance
4 18 (17.14%) Marketing
5 7 (6.67%) Telecoms
6 4 (3.81%) Inclusion and Diversity
6 4 (3.81%) Influencing Skills
7 3 (2.86%) Games
7 3 (2.86%) Legal
7 3 (2.86%) Presentation Skills
8 2 (1.90%) Automotive
8 2 (1.90%) Mandarin Language
9 1 (0.95%) Back Office
9 1 (0.95%) Manufacturing
9 1 (0.95%) Organisational Skills
9 1 (0.95%) Pharmaceutical
9 1 (0.95%) Public Sector
9 1 (0.95%) Retail
Job Titles
1 30 (28.57%) Senior
2 25 (23.81%) Hardware Engineer
2 25 (23.81%) Senior Hardware Engineer
3 23 (21.90%) RF Engineer
3 23 (21.90%) Senior RF Engineer
4 15 (14.29%) Analyst
5 12 (11.43%) Lead
6 11 (10.48%) Software Engineer
7 8 (7.62%) Systems Analyst
8 7 (6.67%) Developer
8 7 (6.67%) IT Technician
9 6 (5.71%) C++ Developer
9 6 (5.71%) Finance Systems Analyst
9 6 (5.71%) Financial Analyst
9 6 (5.71%) Workday Analyst
10 5 (4.76%) Project Leader
11 4 (3.81%) Business Analyst
11 4 (3.81%) Programmer
11 4 (3.81%) Software Programmer
12 3 (2.86%) Principal Engineer
Libraries, Frameworks & Software Standards
1 6 (5.71%) Middleware
1 6 (5.71%) PyQt
1 6 (5.71%) scikit-learn
2 4 (3.81%) Django
2 4 (3.81%) Flask
2 4 (3.81%) React
3 3 (2.86%) .NET
3 3 (2.86%) CryEngine
3 3 (2.86%) DirectX
3 3 (2.86%) LAPP Stack
3 3 (2.86%) REST
3 3 (2.86%) SOAP
3 3 (2.86%) Unity (Game Engine)
3 3 (2.86%) Unreal Engine
3 3 (2.86%) Vulkan
3 3 (2.86%) Web Services
4 2 (1.90%) LLVM
4 2 (1.90%) XML
5 1 (0.95%) GraphQL
5 1 (0.95%) RESTful
Miscellaneous
1 26 (24.76%) IoT
2 14 (13.33%) ARM Cortex
2 14 (13.33%) Verilog
3 12 (11.43%) Self-Motivation
4 8 (7.62%) Client/Server
5 7 (6.67%) Management Information System
5 7 (6.67%) Onboarding
6 6 (5.71%) Cyber Threat
6 6 (5.71%) Embedded Systems
7 5 (4.76%) Algorithms
7 5 (4.76%) Robotics
8 3 (2.86%) Enterprise Software
8 3 (2.86%) Ray Tracing
9 2 (1.90%) Data Structures
9 2 (1.90%) Mali
10 1 (0.95%) Data Centre
10 1 (0.95%) Genomics
10 1 (0.95%) Life Science
10 1 (0.95%) Security Posture
10 1 (0.95%) Smartphone
Operating Systems
1 17 (16.19%) Linux
2 13 (12.38%) Windows
3 4 (3.81%) Android
4 3 (2.86%) AIX
5 2 (1.90%) Apple iOS
5 2 (1.90%) Mac OS
5 2 (1.90%) Mac OS X
5 2 (1.90%) Windows Server
Processes & Methodologies
1 42 (40.00%) Problem-Solving
2 25 (23.81%) CAD
2 25 (23.81%) Software Testing
3 15 (14.29%) User Experience
4 14 (13.33%) Creative Thinking
4 14 (13.33%) Electronic Design Automation
4 14 (13.33%) IC Design
5 13 (12.38%) Computer Science
5 13 (12.38%) Software Engineering
6 12 (11.43%) Agile
7 10 (9.52%) Project Management
8 9 (8.57%) ERP
9 8 (7.62%) Continuous Improvement
9 8 (7.62%) Cybersecurity
10 7 (6.67%) Artificial Intelligence
10 7 (6.67%) Mathematics
10 7 (6.67%) Roadmaps
11 6 (5.71%) Code Quality
11 6 (5.71%) Data Analysis
11 6 (5.71%) Migration
Programming Languages
1 31 (29.52%) Python
2 14 (13.33%) SystemVerilog
2 14 (13.33%) Tcl
3 12 (11.43%) C++
4 7 (6.67%) C
4 7 (6.67%) SQL
5 5 (4.76%) Java
6 4 (3.81%) R
6 4 (3.81%) VBA
7 3 (2.86%) C#
7 3 (2.86%) VB
8 2 (1.90%) JavaScript
8 2 (1.90%) T-SQL
Qualifications
1 56 (53.33%) Degree
2 9 (8.57%) Master's Degree
3 7 (6.67%) CCNA
3 7 (6.67%) Cisco Certification
3 7 (6.67%) MCSE
3 7 (6.67%) Microsoft Certification
4 6 (5.71%) Computer Science Degree
5 3 (2.86%) DBS Check
5 3 (2.86%) MBA
6 2 (1.90%) PhD
7 1 (0.95%) AWS Certification
Quality Assurance & Compliance
1 5 (4.76%) GDPR
2 2 (1.90%) Data Quality
2 2 (1.90%) QA
System Software
1 9 (8.57%) VMware Infrastructure
2 7 (6.67%) Hyper-V
3 2 (1.90%) Active Directory
3 2 (1.90%) Embedded Firmware
3 2 (1.90%) Firmware
4 1 (0.95%) Docker
Systems Management
1 1 (0.95%) Terraform
Vendors
1 12 (11.43%) Microsoft
1 12 (11.43%) Oracle
2 9 (8.57%) VMware
3 6 (5.71%) Sage
3 6 (5.71%) Workday
4 4 (3.81%) Google
4 4 (3.81%) MicroStrategy
4 4 (3.81%) Salesforce
5 3 (2.86%) Virgin Media
6 1 (0.95%) Atlassian