Capacity Planning Jobs in the City of London

Capacity Planning
Central London > City of London

The table below provides summary statistics for permanent job vacancies advertised in the City of London requiring Capacity Planning skills. It includes a benchmarking guide to the annual salaries offered in vacancies that cited Capacity Planning over the 6 months leading up to 24 August 2025, comparing them to the same period in the previous two years.

6 months to
24 Aug 2025
Same period 2024 Same period 2023
Rank 136 158 191
Rank change year-on-year +22 +33 +83
DemandTrendPermanent jobs citing Capacity Planning 8 21 21
As % of all permanent jobs advertised in the City of London 0.44% 0.71% 0.53%
As % of the Processes & Methodologies category 0.46% 0.76% 0.56%
Number of salaries quoted 7 16 8
10th Percentile £62,750 £64,375 £52,125
25th Percentile £72,125 £66,250 £52,500
Median annual salary (50th Percentile) £75,000 £67,500 £65,000
Median % change year-on-year +11.11% +3.85% -7.14%
75th Percentile £83,750 £87,500 £75,250
90th Percentile £86,750 £97,500 £83,950
Central London median annual salary £75,000 £67,500 £65,000
% change year-on-year +11.11% +3.85% -7.14%

All Process and Methodology Skills
City of London

Capacity Planning falls under the Processes and Methodologies category. For comparison with the information above, the following table provides summary statistics for all permanent job vacancies requiring process or methodology skills in the City of London.

DemandTrendPermanent vacancies with a requirement for process or methodology skills 1,755 2,765 3,748
As % of all permanent jobs advertised in the City of London 95.59% 92.97% 95.39%
Number of salaries quoted 1,343 1,943 3,088
10th Percentile £40,000 £43,550 £43,162
25th Percentile £55,000 £55,000 £56,250
Median annual salary (50th Percentile) £75,000 £74,000 £75,000
Median % change year-on-year +1.35% -1.33% +3.45%
75th Percentile £95,000 £95,000 £97,500
90th Percentile £120,000 £112,500 £117,500
Central London median annual salary £75,000 £72,500 £75,000
% change year-on-year +3.45% -3.33% +3.45%

Capacity Planning
Job Vacancy Trend in the City of London

Job postings citing Capacity Planning as a proportion of all IT jobs advertised in the City of London.
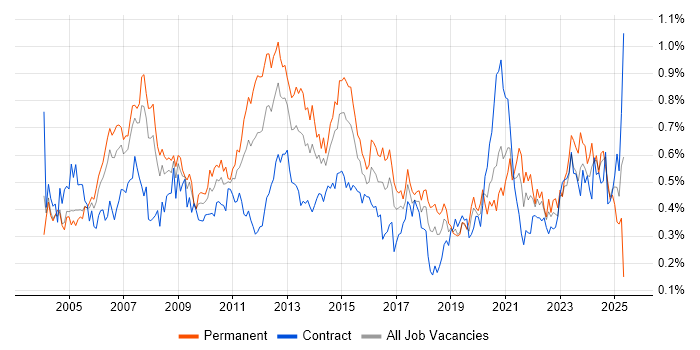
Job vacancy trend for Capacity Planning in the City of London

Capacity Planning
Salary Trend in the City of London

Salary distribution trend for jobs in the City of London citing Capacity Planning.

Salary distribution trend for jobs in the City of London citing Capacity Planning

Capacity Planning
Salary Histogram in the City of London

Salary distribution for jobs citing Capacity Planning in the City of London over the 6 months to 24 August 2025.

Salary histogram for Capacity Planning in the City of London

Capacity Planning
Co-occurring Skills and Capabilities in the City of London by Category

The follow tables expand on the table above by listing co-occurrences grouped by category. The same employment type, locality and period is covered with up to 20 co-occurrences shown in each of the following categories:

Application Platforms
1 2 (25.00%) Microsoft Exchange
2 1 (12.50%) Confluence
Business Applications
1 3 (37.50%) Fidessa
2 1 (12.50%) SAP IBP
2 1 (12.50%) SAP MII
2 1 (12.50%) SAP S/4HANA
Cloud Services
1 5 (62.50%) Azure
2 3 (37.50%) Microsoft 365
3 2 (25.00%) Entra ID
4 1 (12.50%) Power Platform
Communications & Networking
1 4 (50.00%) VPN
2 3 (37.50%) Firewall
2 3 (37.50%) NetScaler
2 3 (37.50%) Network Security
3 1 (12.50%) DHCP
3 1 (12.50%) DNS
3 1 (12.50%) IPsec
3 1 (12.50%) IPv4
3 1 (12.50%) IPv6
3 1 (12.50%) LAN
3 1 (12.50%) WAN
3 1 (12.50%) Wi-Fi
3 1 (12.50%) Wireless
Database & Business Intelligence
1 4 (50.00%) SQL Server
2 1 (12.50%) Power BI
2 1 (12.50%) RDBMS
2 1 (12.50%) Relational Database
2 1 (12.50%) SQL Server Analysis Services
2 1 (12.50%) SQL Server Integration Services
Development Applications
1 1 (12.50%) JIRA
1 1 (12.50%) Visual Studio
General
1 5 (62.50%) Finance
2 4 (50.00%) Analytical Skills
2 4 (50.00%) Banking
2 4 (50.00%) Social Skills
3 1 (12.50%) Automotive
3 1 (12.50%) Inclusion and Diversity
3 1 (12.50%) International Banking
3 1 (12.50%) Law
3 1 (12.50%) Legal
3 1 (12.50%) Manufacturing
3 1 (12.50%) Organisational Skills
3 1 (12.50%) Presentation Skills
Job Titles
1 4 (50.00%) Senior
2 3 (37.50%) Infrastructure Engineer
3 2 (25.00%) IT Engineer
3 2 (25.00%) IT Infrastructure Engineer
3 2 (25.00%) Senior Infrastructure Engineer
3 2 (25.00%) Senior IT Engineer
4 1 (12.50%) Analyst
4 1 (12.50%) Backup Engineer
4 1 (12.50%) Consultant
4 1 (12.50%) Network Engineer
4 1 (12.50%) PMO Analyst
4 1 (12.50%) SAP Consultant
4 1 (12.50%) SAP PP Consultant
4 1 (12.50%) SAP S/4HANA Consultant
4 1 (12.50%) Senior Consultant
4 1 (12.50%) Senior PMO
4 1 (12.50%) Senior PMO Analyst
4 1 (12.50%) Senior SAP Consultant
4 1 (12.50%) Senior SAP PP Consultant
4 1 (12.50%) SQL DBA
Miscellaneous
1 2 (25.00%) Analytical Mindset
2 1 (12.50%) Clustering
2 1 (12.50%) Replication
Operating Systems
1 4 (50.00%) Windows
2 3 (37.50%) Linux
2 3 (37.50%) Windows Server
2 3 (37.50%) Windows Server 2016
Processes & Methodologies
1 4 (50.00%) Customer Service
2 3 (37.50%) BCP
2 3 (37.50%) Business Continuity
2 3 (37.50%) Cybersecurity
2 3 (37.50%) Disaster Recovery
2 3 (37.50%) Infrastructure Engineering
2 3 (37.50%) Mentoring
2 3 (37.50%) Performance Tuning
2 3 (37.50%) Proactive Monitoring
2 3 (37.50%) Technology Strategy
3 2 (25.00%) Business Continuity Planning
3 2 (25.00%) Business Strategy
3 2 (25.00%) Problem-Solving
4 1 (12.50%) Analytical Thinking
4 1 (12.50%) Budget Management
4 1 (12.50%) Business Case
4 1 (12.50%) Decision-Making
4 1 (12.50%) Operational Stability
4 1 (12.50%) Project Delivery
4 1 (12.50%) Workshop Facilitation
Programming Languages
1 3 (37.50%) PowerShell
2 1 (12.50%) SQL
2 1 (12.50%) T-SQL
Qualifications
1 1 (12.50%) Degree
1 1 (12.50%) SAP Certification
Quality Assurance & Compliance
1 1 (12.50%) PMO
System Software
1 4 (50.00%) Active Directory
2 3 (37.50%) Hyper-V
2 3 (37.50%) VMware ESXi
2 3 (37.50%) VMware Infrastructure
Systems Management
1 3 (37.50%) Microsoft Intune
1 3 (37.50%) SCCM
1 3 (37.50%) Single Sign-On
1 3 (37.50%) vCenter Server
2 2 (25.00%) SCOM
3 1 (12.50%) Microsoft Clustering
3 1 (12.50%) NetBackup
Vendors
1 4 (50.00%) Veeam
2 3 (37.50%) Bloomberg
2 3 (37.50%) Cisco
2 3 (37.50%) Citrix
2 3 (37.50%) FactSet
2 3 (37.50%) Fortinet
2 3 (37.50%) Microsoft
2 3 (37.50%) Mitel
2 3 (37.50%) NetApp
2 3 (37.50%) Refinitiv
2 3 (37.50%) VMware
3 1 (12.50%) Aderant
3 1 (12.50%) iManage
3 1 (12.50%) Intapp
3 1 (12.50%) RedGate
3 1 (12.50%) SAP