Analyst Jobs in the City of London

Analyst
Central London > City of London

The median Analyst salary in the City of London is £60,000 per year according to job vacancies posted during the 6 months to 27 April 2024.

The first table below provides salary benchmarking and summary statistics including a comparison to same period in the previous 2 years.

6 months to
27 Apr 2024
Same period 2023 Same period 2022
Rank 13 14 13
Rank change year-on-year +1 -1 +16
Permanent jobs requiring an Analyst 445 675 927
As % of all permanent jobs advertised in the City of London 13.25% 14.14% 13.16%
As % of the Job Titles category 13.83% 14.66% 13.76%
Number of salaries quoted 347 590 790
10th Percentile £36,250 £32,500 £35,000
25th Percentile £46,250 £42,500 £45,000
Median annual salary (50th Percentile) £60,000 £60,000 £60,000
Median % change year-on-year - - +13.74%
75th Percentile £77,500 £75,000 £71,250
90th Percentile £100,000 £87,750 £82,500
Central London median annual salary £60,000 £60,000 £59,000
% change year-on-year - +1.69% +12.38%

All Permanent IT Job Vacancies
City of London

The following table is for comparison with the above and includes summary statistics for all permanent IT job vacancies advertised in the City of London. Most job vacancies include a discernible job title that can be normalized. As such, the figures in the second row provide an indication of the number of permanent jobs in our overall sample.

Permanent vacancies in the City of London with a recognized job title 3,218 4,605 6,736
% of permanent jobs with a recognized job title 95.80% 96.44% 95.63%
Number of salaries quoted 2,571 3,879 5,627
10th Percentile £41,000 £42,500 £45,000
25th Percentile £53,000 £55,000 £56,250
Median annual salary (50th Percentile) £73,000 £75,000 £72,500
Median % change year-on-year -2.67% +3.45% -
75th Percentile £95,000 £97,500 £93,750
90th Percentile £112,500 £112,500 £108,750
Central London median annual salary £72,500 £75,000 £72,500
% change year-on-year -3.33% +3.45% +3.57%

Analyst
Job Vacancy Trend in the City of London

Job postings that featured Analyst in the job title as a proportion of all IT jobs advertised in the City of London.
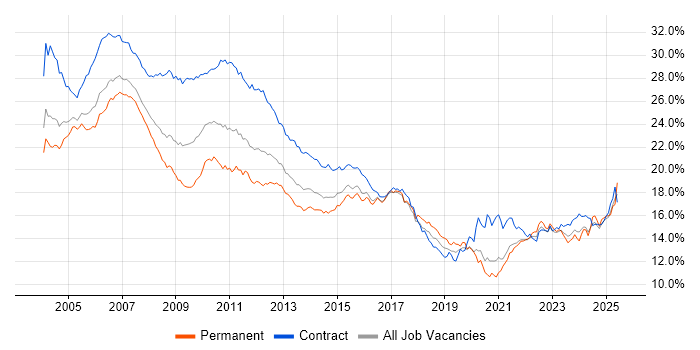
Job vacancy trend for Analyst in the City of London

Analyst
Salary Trend in the City of London

3-month moving average salary quoted in jobs citing Analyst in the City of London.

Salary trend for Analyst in the City of London

Analyst
Salary Histogram in the City of London

Salary distribution for jobs citing Analyst in the City of London over the 6 months to 27 April 2024.

Salary histogram for Analyst in the City of London

Analyst Skill Set
Top 30 Co-occurring Skills and Capabilities in the City of London

For the 6 months to 27 April 2024, Analyst job roles required the following skills and capabilities in order of popularity. The figures indicate the absolute number co-occurrences and as a proportion of all permanent job ads across the City of London region featuring Analyst in the job title.

1 153 (34.38%) Finance
2 148 (33.26%) SQL
3 127 (28.54%) Social Skills
4 97 (21.80%) Analytical Skills
5 88 (19.78%) Degree
6 84 (18.88%) Microsoft
7 73 (16.40%) Python
8 65 (14.61%) Azure
8 65 (14.61%) Analytics
9 64 (14.38%) Agile
10 62 (13.93%) Problem-Solving
11 60 (13.48%) Windows
12 56 (12.58%) Data Analysis
13 53 (11.91%) Microsoft 365
14 52 (11.69%) Power Platform
15 50 (11.24%) Law
16 49 (11.01%) Power BI
17 48 (10.79%) Change Management
17 48 (10.79%) Visualisation
18 45 (10.11%) Cybersecurity
19 43 (9.66%) Information Security
19 43 (9.66%) ITIL
20 42 (9.44%) Actionable Insight
21 41 (9.21%) Legal
21 41 (9.21%) Tableau
21 41 (9.21%) Statistics
22 40 (8.99%) Active Directory
23 39 (8.76%) Microsoft Excel
23 39 (8.76%) Mathematics
24 38 (8.54%) Business Intelligence

Analyst Skill Set
Co-occurring Skills and Capabilities in the City of London by Category

The follow tables expand on the table above by listing co-occurrences grouped by category. The same employment type, locality and period is covered with up to 20 co-occurrences shown in each of the following categories:

Application Platforms
1 19 (4.27%) Microsoft Exchange
2 10 (2.25%) SharePoint
3 4 (0.90%) SAS
4 3 (0.67%) CMS
5 2 (0.45%) Confluence
5 2 (0.45%) Exchange Server 2010
5 2 (0.45%) Jupyter
6 1 (0.22%) EPiServer
6 1 (0.22%) IIS
6 1 (0.22%) Tornado
6 1 (0.22%) WordPress
Applications
1 39 (8.76%) Microsoft Excel
2 38 (8.54%) Microsoft Office
3 15 (3.37%) MS Visio
4 11 (2.47%) Microsoft PowerPoint
5 2 (0.45%) Microsoft Project
5 2 (0.45%) S-PLUS
5 2 (0.45%) Stata
6 1 (0.22%) Spreadsheet
Business Applications
1 14 (3.15%) Aladdin
2 13 (2.92%) thinkFolio
3 6 (1.35%) Carpe Diem
4 5 (1.12%) Elite 3E
5 4 (0.90%) Dynamics CRM
6 2 (0.45%) Endur
6 2 (0.45%) Farmplan
6 2 (0.45%) KEYPrime
6 2 (0.45%) SAP GTS
6 2 (0.45%) SAP Payroll
6 2 (0.45%) Temenos T24
7 1 (0.22%) Finacle
7 1 (0.22%) FLEXCUBE
7 1 (0.22%) IBM Planning Analytics
7 1 (0.22%) ION Anvil
7 1 (0.22%) Loan IQ
7 1 (0.22%) Magento
7 1 (0.22%) Oracle ERP
7 1 (0.22%) SAP HR
7 1 (0.22%) Workday HCM
Cloud Services
1 65 (14.61%) Azure
2 53 (11.91%) Microsoft 365
3 52 (11.69%) Power Platform
4 30 (6.74%) AWS
5 9 (2.02%) Dynamics 365
6 8 (1.80%) Azure DevOps
6 8 (1.80%) Cloud Computing
6 8 (1.80%) Entra ID
6 8 (1.80%) WhatsApp
7 6 (1.35%) GCP
7 6 (1.35%) Microsoft Purview
8 5 (1.12%) Azure Sentinel
9 4 (0.90%) Azure Synapse Analytics
9 4 (0.90%) OCI
9 4 (0.90%) OneDrive
9 4 (0.90%) Rubrik
10 3 (0.67%) Google Drive
10 3 (0.67%) Mimecast
10 3 (0.67%) Power Automate
10 3 (0.67%) PowerApps
Communications & Networking
1 32 (7.19%) Firewall
2 10 (2.25%) TCP/IP
3 8 (1.80%) VPN
4 7 (1.57%) Intrusion Detection
5 6 (1.35%) Broadband
6 5 (1.12%) IPsec
6 5 (1.12%) Network Security
6 5 (1.12%) SSL
7 4 (0.90%) Skype
7 4 (0.90%) VoIP
8 3 (0.67%) Cisco IOS
8 3 (0.67%) LAN
8 3 (0.67%) VLAN
8 3 (0.67%) Wi-Fi
9 2 (0.45%) DNS
9 2 (0.45%) Internet
9 2 (0.45%) PSTN
9 2 (0.45%) SD-WAN
9 2 (0.45%) WAN
10 1 (0.22%) DKIM
Database & Business Intelligence
1 49 (11.01%) Power BI
2 41 (9.21%) Tableau
3 25 (5.62%) SQL Server
4 15 (3.37%) SQL Server Reporting Services
5 11 (2.47%) SQL Server Integration Services
6 9 (2.02%) Data Warehouse
7 7 (1.57%) MySQL
8 6 (1.35%) Relational Database
9 5 (1.12%) Oracle Reports
10 4 (0.90%) Azure SQL Database
11 3 (0.67%) Looker
11 3 (0.67%) SQL Server Analysis Services
12 2 (0.45%) Amazon QuickSight
12 2 (0.45%) Big Data
12 2 (0.45%) Crystal Reports
12 2 (0.45%) Metadata
12 2 (0.45%) QGIS
12 2 (0.45%) SAP HANA
13 1 (0.22%) BigQuery
13 1 (0.22%) KNIME
Development Applications
1 18 (4.04%) Git
2 7 (1.57%) JIRA
2 7 (1.57%) Visual Studio
3 6 (1.35%) Burp Suite
3 6 (1.35%) Metasploit
4 5 (1.12%) Eclipse
5 2 (0.45%) ER Studio
5 2 (0.45%) ERwin
5 2 (0.45%) Selenium
6 1 (0.22%) Atlassian Bamboo
6 1 (0.22%) GDB
6 1 (0.22%) JMeter
6 1 (0.22%) LoadRunner
6 1 (0.22%) SQL Server Management Studio (SSMS)
6 1 (0.22%) TeamCity
General
1 153 (34.38%) Finance
2 127 (28.54%) Social Skills
3 97 (21.80%) Analytical Skills
4 50 (11.24%) Law
5 41 (9.21%) Legal
6 32 (7.19%) Retail
7 25 (5.62%) Presentation Skills
8 20 (4.49%) Banking
9 16 (3.60%) Organisational Skills
10 14 (3.15%) Back Office
10 14 (3.15%) Front Office
11 13 (2.92%) Advertising
12 9 (2.02%) Financial Institution
12 9 (2.02%) Inclusion and Diversity
13 7 (1.57%) Influencing Skills
13 7 (1.57%) Marketing
14 6 (1.35%) Prime Brokerage
15 5 (1.12%) Investment Banking
15 5 (1.12%) Telecoms
16 4 (0.90%) Manufacturing
Libraries, Frameworks & Software Standards
1 16 (3.60%) REST
2 9 (2.02%) .NET
3 8 (1.80%) Web Services
4 5 (1.12%) CSS
4 5 (1.12%) HTML
5 4 (0.90%) XML
6 3 (0.67%) ASP.NET
6 3 (0.67%) JSON
6 3 (0.67%) Oracle Fusion
7 2 (0.45%) AngularJS
7 2 (0.45%) D3.js
7 2 (0.45%) FIX Protocol
7 2 (0.45%) Google Chart
7 2 (0.45%) Great Expectations
7 2 (0.45%) SailPoint
7 2 (0.45%) XSLT
8 1 (0.22%) COM
8 1 (0.22%) React
8 1 (0.22%) SOAP
8 1 (0.22%) STL
Miscellaneous
1 20 (4.49%) Fixed Income
2 15 (3.37%) Video Conferencing
3 13 (2.92%) Management Information System
3 13 (2.92%) Self-Motivation
4 9 (2.02%) Derivative
5 8 (1.80%) Reinsurance
6 7 (1.57%) Foreign Exchange (FX)
7 6 (1.35%) Data Structures
7 6 (1.35%) Security Posture
8 5 (1.12%) Cyber Threat
8 5 (1.12%) Enterprise Software
8 5 (1.12%) Onboarding
9 4 (0.90%) iPhone
9 4 (0.90%) Product Ownership
10 3 (0.67%) Cyber Defence
10 3 (0.67%) Cyber Kill Chain
10 3 (0.67%) Cyberattack
10 3 (0.67%) Greenfield Project
10 3 (0.67%) Legacy Applications
10 3 (0.67%) Security Operations Centre
Operating Systems
1 60 (13.48%) Windows
2 26 (5.84%) Windows 10
3 21 (4.72%) Windows Server
4 11 (2.47%) Linux
5 6 (1.35%) Windows Server 2016
6 5 (1.12%) Apple iOS
6 5 (1.12%) Unix
7 4 (0.90%) Windows 7
8 3 (0.67%) Mac OS X
9 2 (0.45%) Android
9 2 (0.45%) Mac OS
9 2 (0.45%) Windows Server 2019
10 1 (0.22%) Red Hat Enterprise Linux
10 1 (0.22%) VMS
10 1 (0.22%) Windows Server 2003
10 1 (0.22%) Windows Server 2012
Processes & Methodologies
1 65 (14.61%) Analytics
2 64 (14.38%) Agile
3 62 (13.93%) Problem-Solving
4 56 (12.58%) Data Analysis
5 48 (10.79%) Change Management
5 48 (10.79%) Visualisation
6 45 (10.11%) Cybersecurity
7 43 (9.66%) Information Security
7 43 (9.66%) ITIL
8 42 (9.44%) Actionable Insight
9 41 (9.21%) Statistics
10 39 (8.76%) Mathematics
11 38 (8.54%) Business Intelligence
12 36 (8.09%) SIEM
13 34 (7.64%) Stakeholder Management
14 32 (7.19%) Incident Response
15 29 (6.52%) Business Analysis
16 28 (6.29%) Decision-Making
16 28 (6.29%) Stakeholder Engagement
17 27 (6.07%) Incident Management
Programming Languages
1 148 (33.26%) SQL
2 73 (16.40%) Python
3 16 (3.60%) T-SQL
4 15 (3.37%) C#
5 14 (3.15%) C++
6 11 (2.47%) PowerShell
6 11 (2.47%) R
7 8 (1.80%) MATLAB
8 5 (1.12%) VBA
9 3 (0.67%) JavaScript
10 2 (0.45%) C
10 2 (0.45%) Data Analysis Expressions
10 2 (0.45%) Java
10 2 (0.45%) Kusto Query Language
10 2 (0.45%) PL/SQL
11 1 (0.22%) Bash
11 1 (0.22%) PHP
11 1 (0.22%) TypeScript
11 1 (0.22%) VC++
11 1 (0.22%) XPath
Qualifications
1 88 (19.78%) Degree
2 22 (4.94%) CISSP
3 17 (3.82%) DBS Check
4 16 (3.60%) CISA
4 16 (3.60%) Master's Degree
5 13 (2.92%) Security Cleared
6 11 (2.47%) SC Cleared
7 9 (2.02%) PhD
8 8 (1.80%) CompTIA Security+
8 8 (1.80%) GIAC
9 7 (1.57%) CRISC
9 7 (1.57%) ISACA
10 6 (1.35%) ACCA
10 6 (1.35%) CIMA
10 6 (1.35%) MCSA
10 6 (1.35%) Microsoft Certification
11 5 (1.12%) CEH
11 5 (1.12%) CISM
11 5 (1.12%) CompTIA CySA+
12 4 (0.90%) Computer Science Degree
Quality Assurance & Compliance
1 26 (5.84%) Data Quality
2 19 (4.27%) NIST
3 15 (3.37%) ISO/IEC 27001
4 11 (2.47%) GRC
5 8 (1.80%) NCSC
5 8 (1.80%) QA
6 6 (1.35%) PMO
7 5 (1.12%) COBIT
7 5 (1.12%) Cyber Essentials
8 4 (0.90%) Accessibility
9 3 (0.67%) GDPR
9 3 (0.67%) SLA
10 2 (0.45%) ITGC
10 2 (0.45%) Sarbanes-Oxley
11 1 (0.22%) Actionable Recommendations
11 1 (0.22%) California Consumer Privacy Act
11 1 (0.22%) Cyber Essentials PLUS
11 1 (0.22%) EMIR
11 1 (0.22%) GAAP
11 1 (0.22%) SOC 2
System Software
1 40 (8.99%) Active Directory
2 9 (2.02%) VMware Infrastructure
3 1 (0.22%) Virtual Desktop
3 1 (0.22%) VMware Server
Systems Management
1 13 (2.92%) Microsoft Intune
2 9 (2.02%) SCCM
3 6 (1.35%) Nmap
4 4 (0.90%) AirWatch
5 2 (0.45%) Backup Exec
5 2 (0.45%) Jamf Pro
5 2 (0.45%) ZENworks
6 1 (0.22%) cPanel
6 1 (0.22%) CSIRT
6 1 (0.22%) Grafana
6 1 (0.22%) QRadar
6 1 (0.22%) WSUS
Vendors
1 84 (18.88%) Microsoft
2 26 (5.84%) Bloomberg
3 19 (4.27%) Databricks
4 16 (3.60%) Oracle
5 13 (2.92%) Charles River
6 11 (2.47%) Google
6 11 (2.47%) iManage
7 10 (2.25%) Cisco
7 10 (2.25%) Citrix
7 10 (2.25%) Salesforce
8 9 (2.02%) VMware
9 8 (1.80%) Apple
9 8 (1.80%) SAP
10 7 (1.57%) ServiceNow
11 6 (1.35%) FFastFill
11 6 (1.35%) Guidewire
11 6 (1.35%) Refinitiv
12 5 (1.12%) HP
12 5 (1.12%) ION Trading
12 5 (1.12%) Sun