Network Security Job Trends in the City of London

Network Security
Central London > City of London

The table below provides summary statistics and salary benchmarking for jobs advertised in the City of London requiring Network Security skills. It covers permanent job vacancies from the 6 months leading up to 24 November 2025, with comparisons to the same periods in the previous two years.

6 months to
24 Nov 2025
Same period 2024 Same period 2023
Rank 80 83 109
Rank change year-on-year +3 +26 +103
Permanent jobs citing Network Security 43 94 64
As % of all permanent jobs in the City of London 2.46% 3.30% 2.12%
As % of the Communications & Networking category 25.60% 20.70% 14.99%
Number of salaries quoted 36 51 54
10th Percentile £33,000 £65,000 £38,000
25th Percentile £47,813 £73,000 £53,375
Median annual salary (50th Percentile) £75,000 £83,500 £75,000
Median % change year-on-year -10.18% +11.33% +3.45%
75th Percentile £82,500 £104,375 £97,500
90th Percentile £90,625 £125,000 £109,750
Central London median annual salary £75,000 £83,500 £75,000
% change year-on-year -10.18% +11.33% +3.45%

All Communications and Computer Networking Skills
City of London

Network Security falls under the Communications and Computer Networking category. For comparison with the information above, the following table provides summary statistics for all permanent job vacancies requiring communications or computer networking skills in the City of London.

Permanent vacancies with a requirement for communications or computer networking skills 168 454 427
As % of all permanent jobs advertised in the City of London 9.63% 15.92% 14.15%
Number of salaries quoted 137 261 387
10th Percentile £33,800 £37,500 £35,000
25th Percentile £37,500 £50,000 £46,250
Median annual salary (50th Percentile) £60,000 £65,000 £65,000
Median % change year-on-year -7.69% - +4.00%
75th Percentile £82,500 £85,250 £77,500
90th Percentile £95,000 £112,500 £95,500
Central London median annual salary £55,000 £62,500 £62,500
% change year-on-year -12.00% - +4.17%

Network Security
Job Vacancy Trend in the City of London

Historical trend showing the proportion of permanent IT job postings citing Network Security relative to all permanent IT jobs advertised in the City of London.
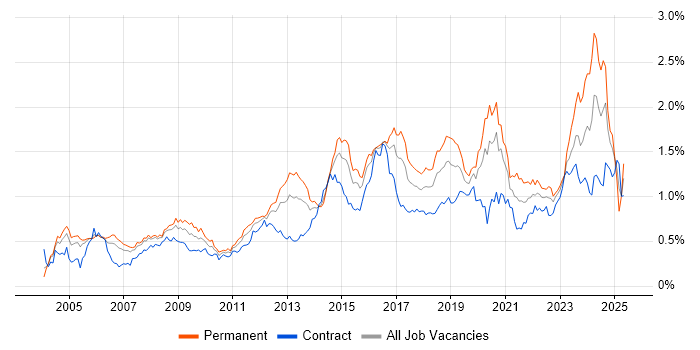
Network Security job vacancy trend in the City of London

Network Security
Salary Trend in the City of London

Salary distribution trend for jobs in the City of London citing Network Security.

Salary distribution trend for jobs in the City of London citing Network Security

Network Security
Salary Histogram in the City of London

Salary distribution for jobs citing Network Security in the City of London over the 6 months to 24 November 2025.

Salary histogram for Network Security in the City of London

Network Security
Co-Occurring Skills & Capabilities in the City of London by Category

The following tables expand on the one above by listing co-occurrences grouped by category. They cover the same employment type, locality and period, with up to 20 co-occurrences shown in each category:

Business Applications
1 5 (11.63%) SAP S/4HANA
Cloud Services
1 15 (34.88%) Azure
2 5 (11.63%) AWS
2 5 (11.63%) Microsoft 365
2 5 (11.63%) Power Automate
3 3 (6.98%) AWS CodePipeline
3 3 (6.98%) Azure DevOps
3 3 (6.98%) Azure Monitor
3 3 (6.98%) PaaS
4 2 (4.65%) AWS CloudFormation
4 2 (4.65%) Azure Key Vault
4 2 (4.65%) Azure Logic Apps
4 2 (4.65%) Entra ID
4 2 (4.65%) Serverless
5 1 (2.33%) AWS Lambda
5 1 (2.33%) Azure Sentinel
5 1 (2.33%) Azure Stack
5 1 (2.33%) GCP
5 1 (2.33%) GitHub
5 1 (2.33%) GitHub Actions
5 1 (2.33%) Virtual Private Cloud
Communications & Networking
1 30 (69.77%) Firewall
2 8 (18.60%) VoIP
3 7 (16.28%) Intrusion Detection
3 7 (16.28%) LAN
3 7 (16.28%) VPN
3 7 (16.28%) WAN
4 6 (13.95%) Wireless
5 5 (11.63%) Wi-Fi
6 4 (9.30%) BGP
6 4 (9.30%) OSPF
6 4 (9.30%) WLAN
7 3 (6.98%) SD-WAN
7 3 (6.98%) Software-Defined Networking
7 3 (6.98%) Spanning Tree
7 3 (6.98%) VLAN
8 2 (4.65%) TCP/IP
9 1 (2.33%) Cisco Wireless
9 1 (2.33%) DHCP
9 1 (2.33%) DNS
9 1 (2.33%) NetScaler
Database & Business Intelligence
1 5 (11.63%) Data Lake
1 5 (11.63%) Data Warehouse
1 5 (11.63%) SAP Data Services
2 1 (2.33%) Amazon RDS
Development Applications
1 5 (11.63%) ER Studio
1 5 (11.63%) Jenkins
2 2 (4.65%) GitLab
2 2 (4.65%) JIRA
3 1 (2.33%) Burp Suite
3 1 (2.33%) CircleCI
General
1 12 (27.91%) Finance
2 11 (25.58%) Social Skills
3 5 (11.63%) Influencing Skills
3 5 (11.63%) Marketing
4 4 (9.30%) Documentation Skills
4 4 (9.30%) Financial Institution
5 3 (6.98%) Mandarin Language
6 1 (2.33%) Analytical Skills
6 1 (2.33%) Banking
6 1 (2.33%) Investment Banking
6 1 (2.33%) Public Sector
Job Titles
1 8 (18.60%) Network Engineer
2 7 (16.28%) Security Engineer
3 5 (11.63%) 2nd/3rd Line Support
3 5 (11.63%) 3rd Line Support
3 5 (11.63%) Architect
3 5 (11.63%) Chief Architect
3 5 (11.63%) IT Support
3 5 (11.63%) Senior
4 4 (9.30%) Azure Engineer
4 4 (9.30%) Information Security Specialist
4 4 (9.30%) Information Specialist
4 4 (9.30%) Infrastructure Engineer
4 4 (9.30%) IT Engineer
4 4 (9.30%) Lead
4 4 (9.30%) Network Technician
4 4 (9.30%) Security Specialist
5 3 (6.98%) Cloud Engineer
5 3 (6.98%) Network Support
5 3 (6.98%) Network Support Technician
5 3 (6.98%) Support Technician
Miscellaneous
1 7 (16.28%) Management Information System
2 5 (11.63%) Tandem
3 4 (9.30%) CMDB
3 4 (9.30%) Data Centre
4 2 (4.65%) Cloud Native
4 2 (4.65%) PKI
5 1 (2.33%) Cyber Defence
5 1 (2.33%) Onboarding
5 1 (2.33%) Security Operations Centre
Operating Systems
1 20 (46.51%) Windows
2 12 (27.91%) Linux
3 6 (13.95%) Windows Server
4 2 (4.65%) VMS
Processes & Methodologies
1 14 (32.56%) SIEM
2 13 (30.23%) Cybersecurity
3 12 (27.91%) Information Security
3 12 (27.91%) Mentoring
4 10 (23.26%) Incident Response
5 9 (20.93%) Infrastructure as Code
5 9 (20.93%) Project Delivery
6 8 (18.60%) Security Architecture
6 8 (18.60%) Vulnerability Assessment
7 7 (16.28%) Change Management
7 7 (16.28%) Collaborative Working
7 7 (16.28%) Microservices
7 7 (16.28%) Penetration Testing
8 6 (13.95%) Continuous Improvement
8 6 (13.95%) Identity Access Management
8 6 (13.95%) Network Monitoring
8 6 (13.95%) Problem-Solving
8 6 (13.95%) Technology Strategy
8 6 (13.95%) Vulnerability Management
9 5 (11.63%) Analytics
Programming Languages
1 11 (25.58%) PowerShell
2 4 (9.30%) Python
3 2 (4.65%) Shell Script
3 2 (4.65%) SQL
4 1 (2.33%) Bash
Qualifications
1 8 (18.60%) CISSP
2 6 (13.95%) Security Cleared
3 5 (11.63%) Degree
3 5 (11.63%) Network+ Certification
4 4 (9.30%) Cisco Certification
4 4 (9.30%) CISM
4 4 (9.30%) CompTIA Security+
4 4 (9.30%) Novell Certification
5 3 (6.98%) CCNP
5 3 (6.98%) CEH
5 3 (6.98%) DBS Check
5 3 (6.98%) GSEC
5 3 (6.98%) SC Cleared
6 2 (4.65%) CCNA
7 1 (2.33%) CCIE
7 1 (2.33%) CCSP
7 1 (2.33%) CISA
7 1 (2.33%) MCSA
7 1 (2.33%) MCSE
7 1 (2.33%) Microsoft Certification
Quality Assurance & Compliance
1 4 (9.30%) GDPR
1 4 (9.30%) ISO/IEC 27001
1 4 (9.30%) NIST
2 1 (2.33%) Cyber Essentials
2 1 (2.33%) HIPAA
2 1 (2.33%) Sarbanes-Oxley
System Software
1 7 (16.28%) VMware Infrastructure
2 6 (13.95%) Active Directory
3 5 (11.63%) Hyper-V
4 3 (6.98%) KVM
5 2 (4.65%) Docker
5 2 (4.65%) VMware NSX
5 2 (4.65%) vSphere
6 1 (2.33%) Terminal Server
Systems Management
1 5 (11.63%) Autotask
1 5 (11.63%) Terraform
2 4 (9.30%) Computer Emergency Response Teams
2 4 (9.30%) CSIRT
3 3 (6.98%) Ansible
3 3 (6.98%) FortiGate
3 3 (6.98%) SCOM
4 2 (4.65%) Kubernetes
4 2 (4.65%) Microsoft Intune
4 2 (4.65%) SCCM
5 1 (2.33%) Argo
5 1 (2.33%) Grafana
5 1 (2.33%) Nessus
5 1 (2.33%) Prometheus
Vendors
1 10 (23.26%) Salesforce
2 8 (18.60%) VMware
3 7 (16.28%) Cisco
3 7 (16.28%) Microsoft
4 6 (13.95%) ServiceNow
5 5 (11.63%) SAP
5 5 (11.63%) SonicWALL
6 3 (6.98%) SolarWinds
6 3 (6.98%) Zscaler
7 2 (4.65%) Fortinet
7 2 (4.65%) Juniper
7 2 (4.65%) Palo Alto
7 2 (4.65%) Sophos
8 1 (2.33%) Aruba
8 1 (2.33%) CheckPoint
8 1 (2.33%) Citrix
8 1 (2.33%) Forcepoint
8 1 (2.33%) HP
8 1 (2.33%) Rapid7
8 1 (2.33%) Stonesoft