IBM Jobs in Edinburgh

IBM
Scotland > Edinburgh

The table below provides summary statistics for permanent job vacancies advertised in Edinburgh requiring knowledge or experience of IBM products and/or services. It includes a benchmarking guide to the annual salaries offered in vacancies that cited IBM over the 6 months leading up to 31 May 2025, comparing them to the same period in the previous two years.

The figures below represent the IT labour market in general and are not representative of salaries within the International Business Machines Corporation.

6 months to
31 May 2025
Same period 2024 Same period 2023
Rank 69 99 118
Rank change year-on-year +30 +19 +34
Permanent jobs citing IBM 13 11 23
As % of all permanent jobs advertised in Edinburgh 1.48% 0.73% 1.22%
As % of the Vendors category 4.94% 2.43% 3.76%
Number of salaries quoted 7 11 19
10th Percentile £53,772 £68,718 £46,454
25th Percentile £64,621 £68,790 £51,833
Median annual salary (50th Percentile) £75,360 £75,669 £69,447
Median % change year-on-year -0.41% +8.96% +12.46%
75th Percentile - £91,934 £77,715
90th Percentile - - £82,500
Scotland median annual salary £40,101 £75,669 £69,447
% change year-on-year -47.01% +8.96% +21.67%

All Vendors
Edinburgh

IBM falls under the Vendor Products and Services category. For comparison with the information above, the following table provides summary statistics for all permanent job vacancies requiring knowledge or experience of all vendor products and services in Edinburgh.

Permanent vacancies with a requirement for knowledge or experience of vendor products and services 263 452 612
As % of all permanent jobs advertised in Edinburgh 29.99% 29.93% 32.35%
Number of salaries quoted 141 280 347
10th Percentile £26,929 £26,250 £32,000
25th Percentile £32,851 £40,000 £42,937
Median annual salary (50th Percentile) £57,500 £57,500 £59,526
Median % change year-on-year - -3.40% +8.23%
75th Percentile £82,500 £71,750 £77,911
90th Percentile £98,474 £85,250 £87,419
Scotland median annual salary £35,000 £50,000 £55,000
% change year-on-year -30.00% -9.09% +10.00%

IBM
Job Vacancy Trend in Edinburgh

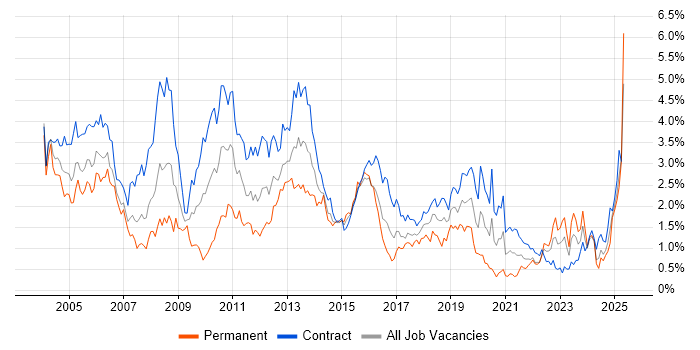
Job postings citing IBM as a proportion of all IT jobs advertised in Edinburgh.

Job vacancy trend for IBM in Edinburgh

IBM
Salary Trend in Edinburgh

3-month moving average salary quoted in jobs citing IBM in Edinburgh.

Salary trend for IBM in Edinburgh

IBM
Salary Histogram in Edinburgh

Salary distribution for jobs citing IBM in Edinburgh over the 6 months to 31 May 2025.

Salary histogram for IBM in Edinburgh

IBM
Co-occurring Skills and Capabilities in Edinburgh by Category

The follow tables expand on the table above by listing co-occurrences grouped by category. The same employment type, locality and period is covered with up to 20 co-occurrences shown in each of the following categories:

Application Platforms
1 4 (30.77%) Apache
1 4 (30.77%) Apache Airflow
2 1 (7.69%) CICS
2 1 (7.69%) WebSphere
Applications
1 2 (15.38%) Chatbot
Cloud Services
1 6 (46.15%) AWS
2 4 (30.77%) CloudBees
2 4 (30.77%) GitHub
3 2 (15.38%) GCP
3 2 (15.38%) OpenShift
Communications & Networking
1 2 (15.38%) FTP
1 2 (15.38%) SNA
1 2 (15.38%) TCP/IP
2 1 (7.69%) PuTTY
Database & Business Intelligence
1 3 (23.08%) DB2
Development Applications
1 4 (30.77%) Jenkins
2 1 (7.69%) JIRA
General
1 3 (23.08%) Analytical Skills
2 2 (15.38%) Banking
2 2 (15.38%) Finance
3 1 (7.69%) Social Skills
Job Titles
1 4 (30.77%) Senior
1 4 (30.77%) Senior Systems Engineer
1 4 (30.77%) Systems Engineer
2 2 (15.38%) Lead
2 2 (15.38%) Lead Software Engineer
2 2 (15.38%) Network Engineer
2 2 (15.38%) Principal Engineer
2 2 (15.38%) Software Engineer
3 1 (7.69%) Analyst
3 1 (7.69%) Field Engineer
3 1 (7.69%) Field Service Engineer
3 1 (7.69%) Infrastructure Engineer
3 1 (7.69%) Mainframe Analyst
3 1 (7.69%) Mainframe Support
3 1 (7.69%) Support Analyst
Miscellaneous
1 4 (30.77%) Cloud Native
1 4 (30.77%) Mainframe
2 2 (15.38%) AS400
2 2 (15.38%) iSeries
3 1 (7.69%) Product Ownership
3 1 (7.69%) Self-Motivation
Operating Systems
1 4 (30.77%) Linux
2 2 (15.38%) zOS
Processes & Methodologies
1 10 (76.92%) Agile
2 6 (46.15%) CI/CD
2 6 (46.15%) Roadmaps
3 5 (38.46%) Continuous Integration
4 4 (30.77%) Continuous Deployment
4 4 (30.77%) Deployment Automation
4 4 (30.77%) DevOps
4 4 (30.77%) Infrastructure as Code
4 4 (30.77%) Platform Engineering
4 4 (30.77%) Software Engineering
4 4 (30.77%) TDD
4 4 (30.77%) Test Automation
4 4 (30.77%) Unit Testing
5 3 (23.08%) Site Reliability Engineering
5 3 (23.08%) Technology Roadmap
6 2 (15.38%) Conversational UI
6 2 (15.38%) Customer-Centricity
6 2 (15.38%) Decision-Making
6 2 (15.38%) Prototyping
6 2 (15.38%) Technical Leadership
Programming Languages
1 8 (61.54%) Python
2 2 (15.38%) Java
2 2 (15.38%) JavaScript
2 2 (15.38%) JCL
2 2 (15.38%) RPG
2 2 (15.38%) RPG IV
2 2 (15.38%) SQL
3 1 (7.69%) PowerShell
Quality Assurance & Compliance
1 1 (7.69%) Sarbanes-Oxley
System Software
1 4 (30.77%) Docker
2 1 (7.69%) RACF
Systems Management
1 5 (38.46%) Ansible
1 5 (38.46%) Terraform
2 2 (15.38%) Tivoli NetView
3 1 (7.69%) Grafana
Vendors
1 4 (30.77%) IBM Sterling
2 1 (7.69%) Broadcom
2 1 (7.69%) Cisco
2 1 (7.69%) Dell
2 1 (7.69%) EMC
2 1 (7.69%) Fujitsu
2 1 (7.69%) Hitachi
2 1 (7.69%) HP
2 1 (7.69%) NetApp
2 1 (7.69%) ServiceNow
2 1 (7.69%) Splunk
2 1 (7.69%) Sun