Master's Degree Jobs in Glasgow

Master's Degree
Scotland > Glasgow

The following table provides summary statistics for permanent job vacancies advertised in Glasgow with a requirement for Master's Degree qualifications. Included is a benchmarking guide to the salaries offered over the 6 months to 25 April 2024 with a comparison to the same period in the previous 2 years.

6 months to
25 Apr 2024
Same period 2023 Same period 2022
Rank 148 71 126
Rank change year-on-year -77 +55 -29
Permanent jobs citing Master's Degree 88 57 8
As % of all permanent jobs advertised in Glasgow 2.23% 3.64% 0.50%
As % of the Qualifications category 14.15% 11.68% 1.79%
Number of salaries quoted 4 7 5
10th Percentile £61,500 £16,800 £26,700
25th Percentile £63,750 £29,775 £27,750
Median annual salary (50th Percentile) £70,000 £55,000 £40,000
Median % change year-on-year +27.27% +37.50% -23.81%
75th Percentile £78,750 £64,369 £75,000
90th Percentile £85,500 £79,492 -
Scotland median annual salary £70,000 £53,000 £70,000
% change year-on-year +32.08% -24.29% +40.00%

All Academic and Professional Certifications
Glasgow

Master's Degree is in the Academic Qualifications and Professional Certifications category. The following table is for comparison with the above and provides summary statistics for all permanent job vacancies advertised in Glasgow with a requirement for academic qualifications or professional certifications.

Permanent vacancies requiring academic qualifications or professional certifications 622 488 447
As % of all permanent jobs advertised in Glasgow 15.79% 31.16% 27.82%
Number of salaries quoted 206 99 215
10th Percentile £28,250 £31,000 £26,750
25th Percentile £36,063 £41,250 £33,375
Median annual salary (50th Percentile) £50,000 £57,500 £47,500
Median % change year-on-year -13.04% +21.05% +7.95%
75th Percentile £62,188 £69,818 £55,000
90th Percentile £78,125 £77,500 £66,250
Scotland median annual salary £50,000 £54,882 £45,000
% change year-on-year -8.90% +21.96% -

Master's Degree
Job Vacancy Trend in Glasgow

Job postings citing Master's Degree as a proportion of all IT jobs advertised in Glasgow.
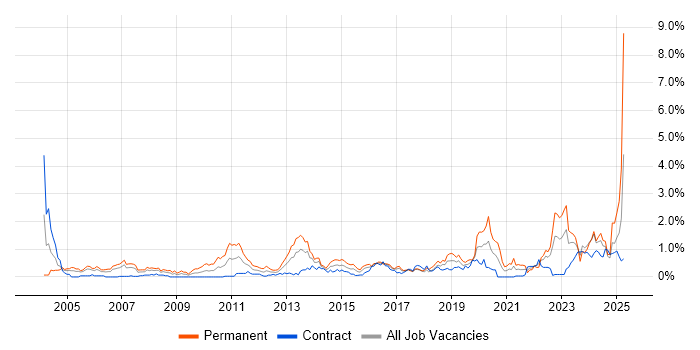
Job vacancy trend for Master's Degree in Glasgow

Master's Degree
Salary Trend in Glasgow

3-month moving average salary quoted in jobs citing Master's Degree in Glasgow.

Salary trend for Master's Degree in Glasgow

Master's Degree
Salary Histogram in Glasgow

Salary distribution for jobs citing Master's Degree in Glasgow over the 6 months to 25 April 2024.

Salary histogram for Master's Degree in Glasgow

Master's Degree
Co-occurring Skills and Capabilities in Glasgow by Category

The follow tables expand on the table above by listing co-occurrences grouped by category. The same employment type, locality and period is covered with up to 20 co-occurrences shown in each of the following categories:

Application Platforms
1 29 (32.95%) FileNet
2 1 (1.14%) Confluence
Applications
1 3 (3.41%) InVision
1 3 (3.41%) Sketch
2 1 (1.14%) Microsoft Excel
2 1 (1.14%) Microsoft PowerPoint
2 1 (1.14%) MS Visio
2 1 (1.14%) Simulink
Cloud Services
1 36 (40.91%) Figma
2 32 (36.36%) SurveyMonkey
3 29 (32.95%) Amazon S3
3 29 (32.95%) GitHub
4 1 (1.14%) AWS
Database & Business Intelligence
1 29 (32.95%) Apache Cassandra
1 29 (32.95%) Elasticsearch
1 29 (32.95%) NoSQL
2 1 (1.14%) MySQL
2 1 (1.14%) PostgreSQL
Development Applications
1 32 (36.36%) Jenkins
2 29 (32.95%) Jasmine
2 29 (32.95%) JUnit
2 29 (32.95%) Mockito
3 3 (3.41%) GitLab
4 1 (1.14%) Artifactory
4 1 (1.14%) JIRA
General
1 81 (92.05%) Inclusion and Diversity
2 80 (90.91%) Finance
2 80 (90.91%) Law
3 68 (77.27%) Marketing
4 32 (36.36%) Social Science
5 22 (25.00%) Social Skills
6 11 (12.50%) Legal
7 4 (4.55%) Banking
8 3 (3.41%) Investment Banking
8 3 (3.41%) Polish Language
9 2 (2.27%) Electronics
9 2 (2.27%) Financial Institution
10 1 (1.14%) Aerospace
10 1 (1.14%) Analytical Skills
10 1 (1.14%) Front Office
10 1 (1.14%) Manufacturing
10 1 (1.14%) Organisational Skills
10 1 (1.14%) Pharmaceutical
10 1 (1.14%) Private Banking
Job Titles
1 34 (38.64%) Lead
2 31 (35.23%) Software Engineer
3 13 (14.77%) User Experience Researcher
4 6 (6.82%) Java Engineer
4 6 (6.82%) Java Software Engineer
5 5 (5.68%) Full Stack Engineer
5 5 (5.68%) Full Stack Software Engineer
5 5 (5.68%) Senior
6 4 (4.55%) Designer
7 3 (3.41%) Artificial Intelligence Engineer
7 3 (3.41%) Senior Designer
7 3 (3.41%) Senior UX Designer
7 3 (3.41%) UX Designer
8 2 (2.27%) Senior User Experience Researcher
8 2 (2.27%) Senior User Researcher
8 2 (2.27%) User Researcher
9 1 (1.14%) Chief Technologist
9 1 (1.14%) Computer Vision Engineer
9 1 (1.14%) Data Scientist
9 1 (1.14%) Technologist
Libraries, Frameworks & Software Standards
1 33 (37.50%) AngularJS
1 33 (37.50%) React
2 29 (32.95%) GraphQL
2 29 (32.95%) Hibernate
2 29 (32.95%) J2EE
2 29 (32.95%) Kafka
2 29 (32.95%) Spring
2 29 (32.95%) Spring Integration
3 4 (4.55%) HTML
3 4 (4.55%) Twitter Bootstrap
4 3 (3.41%) CSS
4 3 (3.41%) LESS
4 3 (3.41%) OpenCV
4 3 (3.41%) OpenVINO
4 3 (3.41%) RESTful
4 3 (3.41%) Sass
5 1 (1.14%) HTML5
5 1 (1.14%) Middleware
5 1 (1.14%) NumPy
5 1 (1.14%) PyTorch
Miscellaneous
1 29 (32.95%) Cloud Native
2 27 (30.68%) Market Risk
3 12 (13.64%) Product Ownership
4 5 (5.68%) Algorithms
5 4 (4.55%) Enterprise Software
6 3 (3.41%) Graphic Design
6 3 (3.41%) Mobile App
7 2 (2.27%) Management Information System
7 2 (2.27%) Video\Live Streaming
8 1 (1.14%) Cyber Threat
8 1 (1.14%) IoT
8 1 (1.14%) Life Science
8 1 (1.14%) Onboarding
8 1 (1.14%) Renewable Energy
8 1 (1.14%) Robotics
Operating Systems
1 2 (2.27%) Linux
1 2 (2.27%) Windows
Processes & Methodologies
1 49 (55.68%) User Experience
2 48 (54.55%) UX Research
3 46 (52.27%) User Research
4 45 (51.14%) Anthropology
4 45 (51.14%) Cognitive Science
4 45 (51.14%) Fintech
4 45 (51.14%) Psychology
5 43 (48.86%) Actionable Insight
5 43 (48.86%) Interaction Design
5 43 (48.86%) Qualitative Research
5 43 (48.86%) Service Design
6 39 (44.32%) Agile
7 37 (42.05%) Product Management
8 35 (39.77%) Artificial Intelligence
9 34 (38.64%) Computer Science
9 34 (38.64%) Machine Learning
10 33 (37.50%) Information Architecture
10 33 (37.50%) Project Planning
10 33 (37.50%) Roadmaps
11 32 (36.36%) Business Strategy
Programming Languages
1 34 (38.64%) R
2 33 (37.50%) SQL
3 31 (35.23%) Java
4 4 (4.55%) Python
5 3 (3.41%) JavaScript
6 2 (2.27%) C++
7 1 (1.14%) Bash
7 1 (1.14%) MATLAB
Qualifications
1 88 (100.00%) Degree
2 49 (55.68%) PhD
3 34 (38.64%) Computer Science Degree
4 4 (4.55%) Security Cleared
5 1 (1.14%) CBAP
5 1 (1.14%) CISM
5 1 (1.14%) CISSP
5 1 (1.14%) DBS Check
Quality Assurance & Compliance
1 5 (5.68%) Accessibility
2 3 (3.41%) WCAG
3 1 (1.14%) GDPR
3 1 (1.14%) QA
System Software
1 2 (2.27%) Docker
Systems Management
1 29 (32.95%) Kubernetes
Vendors
1 32 (36.36%) Qualtrics
2 29 (32.95%) Oracle
3 1 (1.14%) Microsoft
3 1 (1.14%) Thales