Quality Management Jobs

Quality Management
UK

The table below provides summary statistics for permanent job vacancies requiring Quality Management skills. It includes a benchmarking guide to the annual salaries offered in vacancies that cited Quality Management over the 6 months leading up to 31 October 2024, comparing them to the same period in the previous two years.

6 months to
31 Oct 2024
Same period 2023 Same period 2022
Rank 355 528 385
Rank change year-on-year +173 -143 +127
Permanent jobs citing Quality Management 526 237 1,253
As % of all permanent jobs advertised in the UK 0.69% 0.41% 0.90%
As % of the Processes & Methodologies category 0.82% 0.44% 0.94%
Number of salaries quoted 150 94 399
10th Percentile £31,250 £34,125 £31,100
25th Percentile £40,000 £42,533 £37,500
Median annual salary (50th Percentile) £51,250 £55,000 £50,000
Median % change year-on-year -6.82% +10.00% -9.09%
75th Percentile £71,250 £77,188 £65,000
90th Percentile £80,000 £98,375 £83,750
UK excluding London median annual salary £46,500 £51,750 £47,000
% change year-on-year -10.14% +10.11% +4.44%

All Process and Methodology Skills
UK

Quality Management falls under the Processes and Methodologies category. For comparison with the information above, the following table provides summary statistics for all permanent job vacancies requiring process or methodology skills.

Permanent vacancies with a requirement for process or methodology skills 63,881 54,318 133,368
As % of all permanent jobs advertised in the UK 84.08% 94.30% 96.11%
Number of salaries quoted 30,489 39,141 76,332
10th Percentile £34,000 £32,500 £34,000
25th Percentile £45,000 £44,000 £45,000
Median annual salary (50th Percentile) £60,000 £60,000 £60,000
Median % change year-on-year - - +4.35%
75th Percentile £78,000 £80,000 £81,250
90th Percentile £96,250 £97,500 £98,750
UK excluding London median annual salary £54,439 £52,500 £52,500
% change year-on-year +3.69% - +5.00%

Quality Management
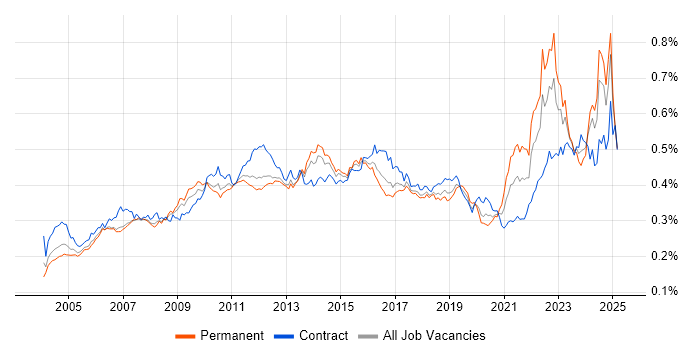
Job Vacancy Trend

Job postings citing Quality Management as a proportion of all IT jobs advertised.

Job vacancy trend for Quality Management in the UK

Quality Management
Salary Trend

3-month moving average salary quoted in jobs citing Quality Management.

Salary trend for Quality Management in the UK

Quality Management
Salary Histogram

Salary distribution for jobs citing Quality Management over the 6 months to 31 October 2024.

Salary histogram for Quality Management in the UK

Quality Management
Top 16 Job Locations

The table below looks at the demand and provides a guide to the median salaries quoted in IT jobs citing Quality Management within the UK over the 6 months to 31 October 2024. The 'Rank Change' column provides an indication of the change in demand within each location based on the same 6 month period last year.

Location Rank Change
on Same Period
Last Year
Matching
Permanent
IT Job Ads
Median Salary
Past 6 Months
Median Salary
% Change
on Same Period
Last Year
Live
Jobs
England +161 484 £54,699 -8.83% 108
UK excluding London +103 304 £46,500 -10.14% 106
London +186 216 £67,500 -6.90% 20
North of England +29 83 £42,500 -34.62% 19
Work from Home +21 81 £64,850 +5.88% 39
South West +41 60 £46,500 -15.45% 21
South East -25 50 £56,509 -3.82% 22
North West -18 45 £40,000 -39.39% 10
East of England -31 44 £45,000 +12.50% 16
Scotland +20 32 £49,500 +11.24% 15
Midlands -24 31 £46,834 +11.51% 22
Yorkshire +35 20 £67,500 +50.00% 6
West Midlands -19 19 £58,250 +5.91% 14
North East - 18 £34,000 - 3
East Midlands -39 12 £40,000 - 8
Wales +33 4 £31,000 -40.95% 2

Quality Management
Co-occurring Skills and Capabilities by Category

The follow tables expand on the table above by listing co-occurrences grouped by category. The same employment type, locality and period is covered with up to 20 co-occurrences shown in each of the following categories:

Application Platforms
1 8 (1.52%) Apache Airflow
1 8 (1.52%) Confluence
2 4 (0.76%) Microsoft Exchange
3 3 (0.57%) SharePoint
Applications
1 14 (2.66%) Microsoft Office
2 11 (2.09%) Microsoft Excel
3 7 (1.33%) Microsoft PowerPoint
3 7 (1.33%) Microsoft Project
4 3 (0.57%) MS Visio
Business Applications
1 4 (0.76%) SAP PP
1 4 (0.76%) SAP QM
1 4 (0.76%) SAP S/4HANA
2 3 (0.57%) assyst
2 3 (0.57%) SAP PM
3 2 (0.38%) Dynamics CRM
3 2 (0.38%) Salesforce CRM
3 2 (0.38%) SAP MM
3 2 (0.38%) SAP SCM
4 1 (0.19%) Oracle EBS R12
4 1 (0.19%) Oracle Financials
4 1 (0.19%) SAP ERP
4 1 (0.19%) SAP MDG
4 1 (0.19%) SAP R/3
4 1 (0.19%) SAP SD
4 1 (0.19%) SAP WM
Cloud Services
1 30 (5.70%) Power Platform
2 27 (5.13%) Azure
3 25 (4.75%) AWS
4 10 (1.90%) OCI
5 9 (1.71%) Microsoft 365
6 8 (1.52%) Alation
7 6 (1.14%) Cloud Computing
7 6 (1.14%) dbt
7 6 (1.14%) GitHub
7 6 (1.14%) Snowflake
8 5 (0.95%) AWS CodeCommit
8 5 (0.95%) Azure Data Factory
8 5 (0.95%) Collibra
8 5 (0.95%) GCP
9 4 (0.76%) Azure Synapse Analytics
10 3 (0.57%) Amazon S3
10 3 (0.57%) Entra ID
10 3 (0.57%) SaaS
10 3 (0.57%) Veeva
10 3 (0.57%) WhatsApp
Communications & Networking
1 11 (2.09%) Radio Access Network
2 8 (1.52%) Link 16
3 4 (0.76%) Firewall
4 3 (0.57%) DHCP
4 3 (0.57%) DNS
5 2 (0.38%) LAN
5 2 (0.38%) OSPF
5 2 (0.38%) TCP/IP
5 2 (0.38%) VLAN
5 2 (0.38%) VoIP
5 2 (0.38%) VPN
5 2 (0.38%) WAN
5 2 (0.38%) Wi-Fi
5 2 (0.38%) Wireless
6 1 (0.19%) Network Security
Database & Business Intelligence
1 30 (5.70%) Power BI
2 10 (1.90%) Data Lake
3 9 (1.71%) Data Warehouse
4 7 (1.33%) Metadata
5 6 (1.14%) Big Data
5 6 (1.14%) Data Vault
5 6 (1.14%) Snowflake Schema
6 5 (0.95%) SQL Server
7 4 (0.76%) Azure SQL Database
7 4 (0.76%) Microsoft Analysis Services
7 4 (0.76%) SQL Server Analysis Services
7 4 (0.76%) SQL Server Integration Services
8 3 (0.57%) DTS
8 3 (0.57%) Geospatial Data
8 3 (0.57%) Relational Database
9 2 (0.38%) Parquet
9 2 (0.38%) PostgreSQL
9 2 (0.38%) SQL Server Reporting Services
10 1 (0.19%) Amazon RDS
10 1 (0.19%) DynamoDB
Development Applications
1 29 (5.51%) Visual Studio
2 25 (4.75%) JIRA
3 11 (2.09%) Git
4 6 (1.14%) Terragrunt
5 2 (0.38%) Tricentis qTest
6 1 (0.19%) GitLab
6 1 (0.19%) Jenkins
General
1 211 (40.11%) Social Skills
2 126 (23.95%) Manufacturing
3 111 (21.10%) Finance
4 78 (14.83%) Legal
5 75 (14.26%) Inclusion and Diversity
6 71 (13.50%) Pharmaceutical
7 63 (11.98%) Retail
8 59 (11.22%) Analytical Skills
9 38 (7.22%) Banking
10 35 (6.65%) Law
11 29 (5.51%) Avionics
12 21 (3.99%) Influencing Skills
13 14 (2.66%) Financial Institution
14 12 (2.28%) Telecoms
15 9 (1.71%) Presentation Skills
16 8 (1.52%) Marketing
17 6 (1.14%) Public Sector
18 4 (0.76%) Organisational Skills
19 2 (0.38%) Documentation Skills
19 2 (0.38%) Public Speaking
Job Titles
1 145 (27.57%) Senior
2 63 (11.98%) Senior Manager
3 49 (9.32%) Quality Manager
4 41 (7.79%) Lead
5 37 (7.03%) Analyst
6 32 (6.08%) Audit Manager
7 28 (5.32%) QA Manager
7 28 (5.32%) QA Officer
8 26 (4.94%) Data Manager
9 20 (3.80%) Risk Manager
10 19 (3.61%) Data Analyst
10 19 (3.61%) Infrastructure Manager
10 19 (3.61%) Senior Infrastructure Manager
10 19 (3.61%) Senior Risk Manager
11 18 (3.42%) Analytics Manager
11 18 (3.42%) Auditor
11 18 (3.42%) Consultant
11 18 (3.42%) Data Analytics Manager
11 18 (3.42%) Project Manager
12 17 (3.23%) Senior Service Manager
Libraries, Frameworks & Software Standards
1 6 (1.14%) Node.js
2 5 (0.95%) NestJS
3 4 (0.76%) EDI
4 3 (0.57%) OpenMP
5 2 (0.38%) D3.js
5 2 (0.38%) GraphQL
5 2 (0.38%) LightGBM
5 2 (0.38%) NumPy
5 2 (0.38%) Oracle Fusion
5 2 (0.38%) Pandas
5 2 (0.38%) pydantic
5 2 (0.38%) RabbitMQ
5 2 (0.38%) React
5 2 (0.38%) SAP Fiori
6 1 (0.19%) Middleware
6 1 (0.19%) XML
Miscellaneous
1 59 (11.22%) Life Science
2 15 (2.85%) Onboarding
3 14 (2.66%) Management Information System
4 12 (2.28%) Driving Licence
5 11 (2.09%) Pharmacovigilance
6 8 (1.52%) Self-Motivation
7 7 (1.33%) Biopharmaceutical
8 5 (0.95%) Analytical Mindset
8 5 (0.95%) Embedded Systems
8 5 (0.95%) Hybrid Cloud
9 4 (0.76%) CMDB
9 4 (0.76%) Data Structures
9 4 (0.76%) Product Ownership
10 3 (0.57%) Algorithms
10 3 (0.57%) CUDA
10 3 (0.57%) Fat Client
10 3 (0.57%) Renewable Energy
10 3 (0.57%) Thin Client
10 3 (0.57%) Virtual Team
11 2 (0.38%) Cloud Native
Operating Systems
1 29 (5.51%) Linux
2 20 (3.80%) Windows
3 5 (0.95%) Android
3 5 (0.95%) Windows Server
4 3 (0.57%) Unix
4 3 (0.57%) VMS
4 3 (0.57%) Windows 10
5 2 (0.38%) Mac OS
5 2 (0.38%) Windows Server 2016
Processes & Methodologies
1 142 (27.00%) QMS
2 122 (23.19%) Risk Management
3 120 (22.81%) Continuous Improvement
4 95 (18.06%) Agile
5 91 (17.30%) Project Management
6 70 (13.31%) Problem-Solving
7 63 (11.98%) Coaching
8 57 (10.84%) Analytics
9 55 (10.46%) Data Governance
10 50 (9.51%) Decision-Making
11 48 (9.13%) Risk Assessment
12 40 (7.60%) Data Analytics
13 37 (7.03%) Data Management
14 35 (6.65%) Cost Management
15 34 (6.46%) Mentoring
16 33 (6.27%) Internal Audit
17 32 (6.08%) Mathematics
17 32 (6.08%) Project Delivery
18 30 (5.70%) ITIL
18 30 (5.70%) Roadmaps
Programming Languages
1 47 (8.94%) SQL
2 37 (7.03%) C
3 29 (5.51%) Python
4 8 (1.52%) C++
5 7 (1.33%) T-SQL
6 5 (0.95%) C#
7 4 (0.76%) PowerShell
8 3 (0.57%) Bash
8 3 (0.57%) C-shell
8 3 (0.57%) Fortran
9 1 (0.19%) ABAP
9 1 (0.19%) Java
9 1 (0.19%) JavaScript
9 1 (0.19%) R
9 1 (0.19%) VBA
Qualifications
1 131 (24.90%) Degree
2 61 (11.60%) ACCA
3 14 (2.66%) ICAEW
4 13 (2.47%) Master's Degree
5 9 (1.71%) SC Cleared
5 9 (1.71%) Security Cleared
6 8 (1.52%) Computer Science Degree
6 8 (1.52%) DBS Check
6 8 (1.52%) HND
7 6 (1.14%) MCP
7 6 (1.14%) Microsoft Certification
8 5 (0.95%) PMI Certification
8 5 (0.95%) PMP
9 4 (0.76%) Cisco Certification
10 3 (0.57%) AWS Certification
10 3 (0.57%) BPSS Clearance
10 3 (0.57%) CCNA
10 3 (0.57%) CompTIA Security+
10 3 (0.57%) ISEB
10 3 (0.57%) PhD
Quality Assurance & Compliance
1 178 (33.84%) QA
2 85 (16.16%) Data Quality
3 57 (10.84%) IFRS
4 52 (9.89%) GMP
5 31 (5.89%) Good Clinical Practice
6 29 (5.51%) ISO 9001
7 25 (4.75%) NEBOSH
8 20 (3.80%) GLP
8 20 (3.80%) ISO/IEC 27001
9 16 (3.04%) SLA
10 14 (2.66%) IFRS 9
10 14 (2.66%) ISO 14001
11 11 (2.09%) ISO 22301
12 10 (1.90%) GDPR
13 7 (1.33%) GxP
14 6 (1.14%) PMO
15 5 (0.95%) Sarbanes-Oxley
16 3 (0.57%) California Consumer Privacy Act
16 3 (0.57%) ISO/IEC 17025
16 3 (0.57%) ITGC
System Software
1 19 (3.61%) Virtual Machines
2 8 (1.52%) Active Directory
2 8 (1.52%) Docker
2 8 (1.52%) Firmware
3 6 (1.14%) Embedded Firmware
4 3 (0.57%) VMware Infrastructure
5 2 (0.38%) Hyper-V
5 2 (0.38%) VMware Workstation
Systems Management
1 9 (1.71%) Terraform
2 5 (0.95%) Microsoft Intune
3 3 (0.57%) Kubernetes
3 3 (0.57%) SCCM
3 3 (0.57%) Single Sign-On
4 2 (0.38%) Active Directory Federation Services
4 2 (0.38%) Autotask
4 2 (0.38%) Failover Clustering
4 2 (0.38%) Grafana
4 2 (0.38%) Jamf Pro
4 2 (0.38%) Prometheus
Vendors
1 66 (12.55%) Microsoft
2 20 (3.80%) SAP
3 12 (2.28%) Oracle
4 10 (1.90%) Google
5 9 (1.71%) BT
5 9 (1.71%) Databricks
6 7 (1.33%) Salesforce
7 6 (1.14%) MicroStrategy
8 4 (0.76%) ServiceNow
8 4 (0.76%) VMware
9 3 (0.57%) IBM
9 3 (0.57%) Kronos
9 3 (0.57%) Sophos
10 2 (0.38%) Aruba
10 2 (0.38%) Datto
10 2 (0.38%) Informatica
10 2 (0.38%) SolarWinds
10 2 (0.38%) Veeam
11 1 (0.19%) Remedy
11 1 (0.19%) SYSPRO