Developer
Scotland > Glasgow
The median Developer daily rate in Glasgow is £467, according to job vacancies posted in the 6 months leading up to 30 May 2025.
The table below provides contractor rate benchmarking and summary statistics, comparing them to the same period in the previous two years.
| 6 months to 30 May 2025 |
Same period 2024 | Same period 2023 | |
|---|---|---|---|
| Rank | 3 | 2 | 8 |
| Rank change year-on-year | -1 | +6 | -3 |
| Contract jobs requiring a Developer | 219 | 166 | 146 |
| As % of all contract jobs advertised in Glasgow | 28.82% | 20.47% | 16.42% |
| As % of the Job Titles category | 30.12% | 21.59% | 17.28% |
| Number of daily rates quoted | 103 | 114 | 93 |
| 10th Percentile | £300 | £323 | £403 |
| 25th Percentile | £410 | £397 | £460 |
| Median daily rate (50th Percentile) | £467 | £450 | £525 |
| Median % change year-on-year | +3.78% | -14.29% | +16.67% |
| 75th Percentile | £525 | £500 | £725 |
| 90th Percentile | £575 | £568 | £750 |
| Scotland median daily rate | £463 | £450 | £475 |
| % change year-on-year | +2.78% | -5.26% | +2.15% |
| Number of hourly rates quoted | 0 | 2 | 1 |
| Median hourly rate | - | £38.38 | £47.73 |
| Median % change year-on-year | - | -19.59% | +1.55% |
| Scotland median hourly rate | - | £38.38 | £59.03 |
| % change year-on-year | - | -34.99% | +8.31% |
All Contract IT Job Vacancies
Glasgow
For comparison with the information above, the following table provides summary statistics for all contract IT job vacancies in Glasgow. Most job vacancies include a discernible job title that can be normalized. As such, the figures in the second row provide an indication of the number of contract jobs in our overall sample.
| Contract vacancies in Glasgow with a recognized job title | 727 | 769 | 845 |
| % of contract IT jobs with a recognized job title | 95.66% | 94.82% | 95.05% |
| Number of daily rates quoted | 455 | 517 | 599 |
| 10th Percentile | £300 | £260 | £325 |
| 25th Percentile | £370 | £363 | £410 |
| Median daily rate (50th Percentile) | £450 | £450 | £479 |
| Median % change year-on-year | - | -6.05% | +6.44% |
| 75th Percentile | £542 | £570 | £583 |
| 90th Percentile | £600 | £623 | £700 |
| Scotland median daily rate | £450 | £453 | £475 |
| % change year-on-year | -0.66% | -4.63% | +1.06% |
| Number of hourly rates quoted | 10 | 37 | 21 |
| 10th Percentile | £16.66 | £12.03 | £12.13 |
| 25th Percentile | £16.84 | £16.00 | £13.16 |
| Median hourly rate | £19.71 | £40.94 | £14.50 |
| Median % change year-on-year | -51.86% | +182.34% | -61.26% |
| 75th Percentile | £23.86 | £53.75 | £47.73 |
| 90th Percentile | £66.02 | £67.50 | £60.55 |
| Scotland median hourly rate | £18.62 | £20.57 | £19.88 |
| % change year-on-year | -9.47% | +3.47% | -46.89% |
Developer
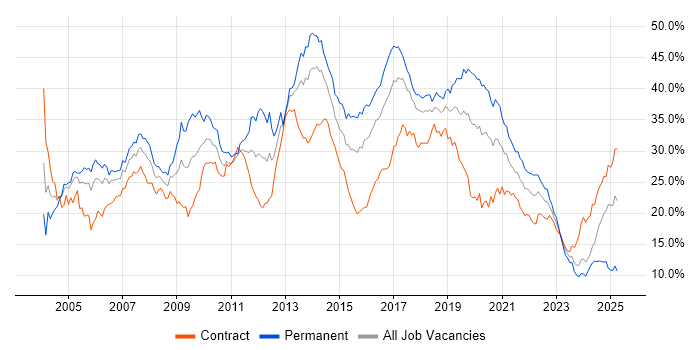
Job Vacancy Trend in Glasgow
Job postings that featured Developer in the job title as a proportion of all IT jobs advertised in Glasgow.

Developer
Contractor Daily Rate Trend in Glasgow
3-month moving average daily rate quoted in jobs citing Developer in Glasgow.
Developer
Daily Rate Histogram in Glasgow
Daily rate distribution for jobs citing Developer in Glasgow over the 6 months to 30 May 2025.
Developer
Contractor Hourly Rate Trend in Glasgow
3-month moving average hourly rates quoted in jobs citing Developer in Glasgow.
Developer Skill Set
Top 30 Co-occurring Skills and Capabilities in Glasgow
For the 6 months to 30 May 2025, Developer contract job roles required the following skills and capabilities in order of popularity. The figures indicate the absolute number co-occurrences and as a proportion of all contract job ads across the Glasgow region featuring Developer in the job title.
|
|
Developer Skill Set
Co-occurring Skills and Capabilities in Glasgow by Category
The follow tables expand on the table above by listing co-occurrences grouped by category. The same employment type, locality and period is covered with up to 20 co-occurrences shown in each of the following categories:
|
|
||||||||||||||||||||||||||||||||||||||||||||||||||||||||||||||||||||||||||||||||||||||||||||||||||||||||||||||||||||||||||||||
|
|
||||||||||||||||||||||||||||||||||||||||||||||||||||||||||||||||||||||||||||||||||||||||||||||||||||||||||||||||||||||||||||||
|
|
||||||||||||||||||||||||||||||||||||||||||||||||||||||||||||||||||||||||||||||||||||||||||||||||||||||||||||||||||||||||||||||
|
|
||||||||||||||||||||||||||||||||||||||||||||||||||||||||||||||||||||||||||||||||||||||||||||||||||||||||||||||||||||||||||||||
|
|
||||||||||||||||||||||||||||||||||||||||||||||||||||||||||||||||||||||||||||||||||||||||||||||||||||||||||||||||||||||||||||||
|
|
||||||||||||||||||||||||||||||||||||||||||||||||||||||||||||||||||||||||||||||||||||||||||||||||||||||||||||||||||||||||||||||
|
|
||||||||||||||||||||||||||||||||||||||||||||||||||||||||||||||||||||||||||||||||||||||||||||||||||||||||||||||||||||||||||||||
|
|
||||||||||||||||||||||||||||||||||||||||||||||||||||||||||||||||||||||||||||||||||||||||||||||||||||||||||||||||||||||||||||||
|
|||||||||||||||||||||||||||||||||||||||||||||||||||||||||||||||||||||||||||||||||||||||||||||||||||||||||||||||||||||||||||||||
