Linux Contracts in the North of England

Linux
England > North of England

The table below provides summary statistics for contract job vacancies advertised in the North of England requiring Linux skills. It includes a benchmarking guide to the contractor rates offered in vacancies that cited Linux over the 6 months leading up to 19 May 2025, comparing them to the same period in the previous two years.

6 months to
19 May 2025
Same period 2024 Same period 2023
Rank 33 39 31
Rank change year-on-year +6 -8 -3
Contract jobs citing Linux 197 188 313
As % of all contract jobs advertised in the North of England 5.94% 4.06% 5.59%
As % of the Operating Systems category 36.48% 27.25% 35.25%
Number of daily rates quoted 121 130 228
10th Percentile £350 £350 £326
25th Percentile £385 £415 £463
Median daily rate (50th Percentile) £525 £478 £549
Median % change year-on-year +9.95% -12.98% +4.52%
75th Percentile £588 £588 £650
90th Percentile £712 £650 £700
England median daily rate £550 £550 £600
% change year-on-year - -8.33% +4.35%
Number of hourly rates quoted 0 11 19
10th Percentile - - £18.50
25th Percentile - £21.25 £25.75
Median hourly rate - £48.00 £37.50
Median % change year-on-year - +28.00% -11.76%
75th Percentile - £55.88 £49.08
90th Percentile - £65.00 £52.13
England median hourly rate £65.00 £65.00 £65.00
% change year-on-year - - +13.04%

All Operating Systems
North of England

Linux falls under the Operating Systems category. For comparison with the information above, the following table provides summary statistics for all contract job vacancies requiring operating system skills in the North of England.

Contract vacancies with a requirement for operating system skills 540 690 888
As % of all contract IT jobs advertised in the North of England 16.29% 14.89% 15.85%
Number of daily rates quoted 342 466 619
10th Percentile £160 £165 £165
25th Percentile £213 £275 £250
Median daily rate (50th Percentile) £400 £425 £475
Median % change year-on-year -5.88% -10.53% +13.10%
75th Percentile £538 £529 £575
90th Percentile £621 £650 £675
England median daily rate £473 £475 £513
% change year-on-year -0.53% -7.32% +2.50%
Number of hourly rates quoted 19 79 62
10th Percentile £13.00 - £13.24
25th Percentile £13.60 £10.95 £17.31
Median hourly rate £17.44 £16.00 £26.50
Median % change year-on-year +9.00% -39.62% +43.24%
75th Percentile £18.75 £19.63 £43.75
90th Percentile £19.55 £32.60 £49.52
England median hourly rate £21.28 £22.00 £37.50
% change year-on-year -3.27% -41.33% +70.45%

Linux
Job Vacancy Trend in the North of England

Job postings citing Linux as a proportion of all IT jobs advertised in the North of England.
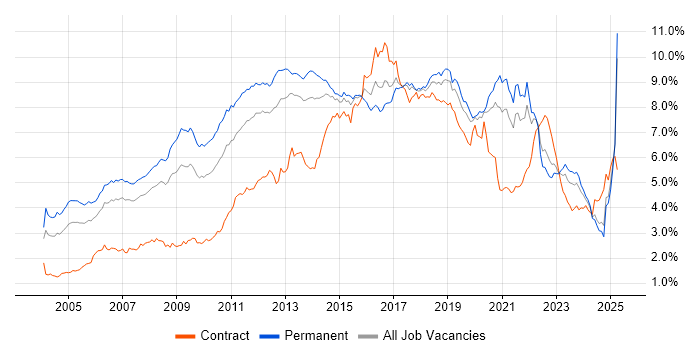
Job vacancy trend for Linux in the North of England

Linux
Contractor Daily Rate Trend in the North of England

3-month moving average daily rate quoted in jobs citing Linux in the North of England.

Daily rate trend for Linux in the North of England

Linux
Daily Rate Histogram in the North of England

Daily rate distribution for jobs citing Linux in the North of England over the 6 months to 19 May 2025.

Daily rate histogram for Linux in the North of England

Linux
Contractor Hourly Rate Trend in the North of England

3-month moving average hourly rates quoted in jobs citing Linux in the North of England.

Hourly rate trend for Linux in the North of England

Linux
Contract Job Locations in the North of England

The table below looks at the demand and provides a guide to the median contractor rates quoted in IT jobs citing Linux within the North of England region over the 6 months to 19 May 2025. The 'Rank Change' column provides an indication of the change in demand within each location based on the same 6 month period last year.

Location Rank Change
on Same Period
Last Year
Matching
Contract
IT Job Ads
Median
Daily Rate
Past 6 Months
Median Daily Rate
% Change
on Same Period
Last Year
Live
Jobs
North West +34 99 £500 +11.11% 269
Yorkshire +4 89 £544 +10.41% 107
North East -5 12 £525 -8.70% 34
Linux
England

Linux
Co-occurring Skills and Capabilities in the North of England by Category

The follow tables expand on the table above by listing co-occurrences grouped by category. The same employment type, locality and period is covered with up to 20 co-occurrences shown in each of the following categories:

Application Platforms
1 16 (8.12%) Oracle SOA Suite
2 10 (5.08%) Microsoft Exchange
3 8 (4.06%) Mattermost
3 8 (4.06%) Skype for Business
4 6 (3.05%) Confluence
4 6 (3.05%) JBoss
4 6 (3.05%) Tomcat
5 4 (2.03%) Apache
5 4 (2.03%) nginx
5 4 (2.03%) SharePoint
6 3 (1.52%) Documentum
6 3 (1.52%) FileNet
7 2 (1.02%) IIS
7 2 (1.02%) Oracle Workflow
7 2 (1.02%) WebSphere
7 2 (1.02%) WebSphere Application Server
8 1 (0.51%) Apache Airflow
8 1 (0.51%) Apache Spark
8 1 (0.51%) Traefik
Applications
1 6 (3.05%) Microsoft Office
2 3 (1.52%) MS Visio
Business Applications
1 5 (2.54%) Kondor
2 2 (1.02%) Oracle Applications
3 1 (0.51%) Oracle EBS
Cloud Services
1 62 (31.47%) AWS
2 40 (20.30%) Azure
3 23 (11.68%) GCP
4 15 (7.61%) AWS CloudFormation
5 14 (7.11%) Entra ID
6 9 (4.57%) Amazon EC2
7 8 (4.06%) Amazon ECS
7 8 (4.06%) Microsoft 365
8 7 (3.55%) OpenShift
8 7 (3.55%) Serverless
9 6 (3.05%) Amazon CloudWatch
9 6 (3.05%) GitHub
10 5 (2.54%) Amazon S3
10 5 (2.54%) Collibra
10 5 (2.54%) npm
11 4 (2.03%) Amazon OpenSearch
11 4 (2.03%) Cloud Computing
11 4 (2.03%) OneDrive
11 4 (2.03%) Slack
11 4 (2.03%) Virtual Private Cloud
Communications & Networking
1 32 (16.24%) DNS
2 14 (7.11%) SAN
3 11 (5.58%) Firewall
3 11 (5.58%) NAS
4 8 (4.06%) DHCP
4 8 (4.06%) Skype
4 8 (4.06%) Softphone
4 8 (4.06%) Unified Communications
4 8 (4.06%) WebEx
5 7 (3.55%) HTTP
5 7 (3.55%) LAN
6 6 (3.05%) Network Security
6 6 (3.05%) TCP/IP
7 5 (2.54%) WAN
8 4 (2.03%) Internet
8 4 (2.03%) Kerberos
8 4 (2.03%) Wireless
9 3 (1.52%) VPN
9 3 (1.52%) Wi-Fi
9 3 (1.52%) WLAN
Database & Business Intelligence
1 24 (12.18%) Oracle Database
2 14 (7.11%) MongoDB
2 14 (7.11%) SQL Server
3 10 (5.08%) PostgreSQL
4 8 (4.06%) MySQL
5 7 (3.55%) Relational Database
6 6 (3.05%) RDBMS
6 6 (3.05%) Siebel EIM
7 5 (2.54%) Apache Cassandra
7 5 (2.54%) Elasticsearch
8 3 (1.52%) BigQuery
8 3 (1.52%) Hadoop
9 2 (1.02%) Big Data
9 2 (1.02%) DynamoDB
9 2 (1.02%) Hazelcast
9 2 (1.02%) Oracle Database 10g
9 2 (1.02%) Oracle Database 11g
9 2 (1.02%) Oracle Reports
10 1 (0.51%) DB2
10 1 (0.51%) SQLite
Development Applications
1 33 (16.75%) GitLab
2 31 (15.74%) Jenkins
3 27 (13.71%) Git
4 15 (7.61%) JIRA
5 8 (4.06%) Jasmine
6 6 (3.05%) Sonatype Nexus
7 5 (2.54%) Bitbucket Server
7 5 (2.54%) CA Release Automation
7 5 (2.54%) JUnit
7 5 (2.54%) SonarQube
7 5 (2.54%) TeamCity
8 4 (2.03%) Cucumber
8 4 (2.03%) Maven
8 4 (2.03%) Mocha
8 4 (2.03%) Selenium
8 4 (2.03%) Subversion
9 3 (1.52%) Eclipse
9 3 (1.52%) Grunt
9 3 (1.52%) gulp
9 3 (1.52%) webpack
General
1 56 (28.43%) Social Skills
2 29 (14.72%) Public Sector
3 27 (13.71%) Finance
4 22 (11.17%) Banking
5 14 (7.11%) Analytical Skills
6 8 (4.06%) Documentation Skills
6 8 (4.06%) Law
7 5 (2.54%) Inclusion and Diversity
7 5 (2.54%) Organisational Skills
7 5 (2.54%) Pharmaceutical
7 5 (2.54%) Telecoms
8 4 (2.03%) Legal
9 2 (1.02%) Aviation
9 2 (1.02%) Electronics
9 2 (1.02%) Fire and Rescue
9 2 (1.02%) Manufacturing
9 2 (1.02%) Marketing
9 2 (1.02%) Military
9 2 (1.02%) Police
9 2 (1.02%) Swedish Language
Job Titles
1 32 (16.24%) Developer
2 31 (15.74%) DevOps Engineer
3 30 (15.23%) Infrastructure Engineer
4 22 (11.17%) Linux Engineer
4 22 (11.17%) Senior
5 15 (7.61%) Architect
6 13 (6.60%) Senior DevOps
6 13 (6.60%) Support Engineer
7 12 (6.09%) Analyst
7 12 (6.09%) Senior DevOps Engineer
8 11 (5.58%) Infrastructure Specialist
8 11 (5.58%) Support Analyst
9 10 (5.08%) Engineering Specialist
9 10 (5.08%) IT Engineer
10 9 (4.57%) IT Infrastructure Engineer
11 8 (4.06%) Messaging Support
11 8 (4.06%) Messaging Support Engineer
11 8 (4.06%) Operations Engineer
11 8 (4.06%) Operations Support Engineer
11 8 (4.06%) Security Engineer
Libraries, Frameworks & Software Standards
1 12 (6.09%) SOAP
2 11 (5.58%) Spring Boot
3 10 (5.08%) Middleware
3 10 (5.08%) RESTful
4 9 (4.57%) REST
4 9 (4.57%) Web Services
5 8 (4.06%) cloud-init
5 8 (4.06%) Elastic Stack
5 8 (4.06%) pytest
5 8 (4.06%) XMPP
6 7 (3.55%) CSS
6 7 (3.55%) HTML
6 7 (3.55%) LDAP
7 6 (3.05%) JMS
7 6 (3.05%) Node.js
7 6 (3.05%) Spring
8 5 (2.54%) OpenTelemetry
8 5 (2.54%) Spring Batch
8 5 (2.54%) Spring Security
9 4 (2.03%) OpenAPI
Miscellaneous
1 19 (9.64%) Linux Command Line
2 13 (6.60%) Data Protection Act
3 12 (6.09%) Data Centre
4 11 (5.58%) Hybrid Cloud
4 11 (5.58%) Management Information System
5 6 (3.05%) Replication
6 5 (2.54%) Cloud Native
6 5 (2.54%) Derivative
6 5 (2.54%) Foreign Exchange (FX)
7 4 (2.03%) Distributed Denial-of-Service
7 4 (2.03%) Mainframe
8 3 (1.52%) Clustering
8 3 (1.52%) Driving Licence
8 3 (1.52%) IVR
8 3 (1.52%) Robotics
8 3 (1.52%) Security Posture
9 2 (1.02%) Analytical Mindset
9 2 (1.02%) Enterprise Storage
9 2 (1.02%) Mobile App
9 2 (1.02%) Virtual Team
Operating Systems
1 79 (40.10%) Windows
2 50 (25.38%) Red Hat Enterprise Linux
3 46 (23.35%) Windows Server
4 40 (20.30%) Unix
5 13 (6.60%) CentOS
6 10 (5.08%) Windows Server 2016
7 9 (4.57%) Solaris
8 8 (4.06%) Windows Server 2019
9 6 (3.05%) HPUX
10 5 (2.54%) Android
11 4 (2.03%) Windows Server 2012
12 3 (1.52%) AIX
12 3 (1.52%) Mac OS X
12 3 (1.52%) Ubuntu
12 3 (1.52%) VMS
12 3 (1.52%) Windows Server 2003
13 2 (1.02%) Apple iOS
13 2 (1.02%) Mac OS
14 1 (0.51%) Amazon Linux
14 1 (0.51%) Oracle Linux
Processes & Methodologies
1 56 (28.43%) Problem-Solving
2 55 (27.92%) CI/CD
3 48 (24.37%) Microservices
4 45 (22.84%) Agile
4 45 (22.84%) DevOps
5 43 (21.83%) Infrastructure Engineering
6 30 (15.23%) Migration
7 24 (12.18%) Infrastructure as Code
8 22 (11.17%) Security Management
9 21 (10.66%) Containerisation
10 19 (9.64%) High Availability
11 18 (9.14%) ITIL
12 17 (8.63%) Disaster Recovery
13 16 (8.12%) SOA
14 15 (7.61%) Continuous Integration
14 15 (7.61%) Data Protection
14 15 (7.61%) Server Management
15 14 (7.11%) Performance Tuning
15 14 (7.11%) Roadmaps
16 12 (6.09%) Deployment Automation
Programming Languages
1 62 (31.47%) Python
2 57 (28.93%) SQL
3 51 (25.89%) Bash
4 34 (17.26%) PowerShell
5 27 (13.71%) Perl
6 26 (13.20%) Java
6 26 (13.20%) PL/SQL
7 19 (9.64%) Shell Script
8 16 (8.12%) JavaScript
9 9 (4.57%) Go
10 6 (3.05%) Ruby
11 4 (2.03%) C++
11 4 (2.03%) Groovy
12 3 (1.52%) Rust
13 2 (1.02%) ActionScript
13 2 (1.02%) ActionScript 2.0
14 1 (0.51%) Bicep
14 1 (0.51%) Korn
14 1 (0.51%) TypeScript
Qualifications
1 52 (26.40%) Security Cleared
2 45 (22.84%) SC Cleared
3 20 (10.15%) Cisco Certification
4 8 (4.06%) ITIL Certification
5 7 (3.55%) Microsoft Certification
6 5 (2.54%) RHCE
6 5 (2.54%) VMware Certified Professional (VCP)
7 4 (2.03%) MCSE
8 3 (1.52%) AWS Certification
8 3 (1.52%) BPSS Clearance
8 3 (1.52%) Degree
9 2 (1.02%) Computer Science Degree
9 2 (1.02%) IBM Certification
10 1 (0.51%) A+ Certification
10 1 (0.51%) DV Cleared
10 1 (0.51%) Network+ Certification
Quality Assurance & Compliance
1 8 (4.06%) Accessibility
2 5 (2.54%) Basel III
2 5 (2.54%) HL7
2 5 (2.54%) ISO/IEC 27001
2 5 (2.54%) MiFID
2 5 (2.54%) SLA
3 4 (2.03%) WCAG
4 2 (1.02%) NCSC
4 2 (1.02%) NIST
4 2 (1.02%) PCI DSS
4 2 (1.02%) QA
System Software
1 61 (30.96%) Active Directory
2 32 (16.24%) Docker
3 18 (9.14%) VMware Infrastructure
4 8 (4.06%) Virtual Machines
4 8 (4.06%) VMware ESXi
4 8 (4.06%) VMware NSX
5 5 (2.54%) vSphere
6 4 (2.03%) Virtual Servers
7 3 (1.52%) Microsoft Virtual Server
8 2 (1.02%) KVM
8 2 (1.02%) Veritas Cluster Server
9 1 (0.51%) Apache ZooKeeper
9 1 (0.51%) Hyper-V
9 1 (0.51%) Oracle RAC
Systems Management
1 51 (25.89%) Kubernetes
2 38 (19.29%) Terraform
3 28 (14.21%) Ansible
4 19 (9.64%) Grafana
5 13 (6.60%) Progress Chef
5 13 (6.60%) Prometheus
6 12 (6.09%) vCenter Server
7 10 (5.08%) Packer
7 10 (5.08%) Puppet
8 8 (4.06%) Kibana
8 8 (4.06%) SCOM
9 7 (3.55%) Istio
10 6 (3.05%) ZABBIX
11 5 (2.54%) Control-M
11 5 (2.54%) vRealize
12 4 (2.03%) WSUS
13 3 (1.52%) Backup Exec
13 3 (1.52%) FortiGate
13 3 (1.52%) Nagios
13 3 (1.52%) SELinux
Vendors
1 46 (23.35%) Oracle
2 40 (20.30%) Cisco
3 35 (17.77%) Red Hat
4 32 (16.24%) Microsoft
5 31 (15.74%) Splunk
6 29 (14.72%) VMware
7 12 (6.09%) AppDynamics
7 12 (6.09%) IBM
8 10 (5.08%) Veeam
9 8 (4.06%) HP
10 6 (3.05%) Siebel
11 5 (2.54%) Fortinet
11 5 (2.54%) Sybase
11 5 (2.54%) Veritas
12 4 (2.03%) Apple
12 4 (2.03%) Citrix
12 4 (2.03%) Cloudera
12 4 (2.03%) Sun
13 3 (1.52%) Unisys
13 3 (1.52%) xMatters