Linux Jobs in the North of England

Linux
England > North of England

The following table provides summary statistics for permanent job vacancies advertised in the North of England with a requirement for Linux skills. Included is a benchmarking guide to the salaries offered in vacancies that have cited Linux over the 6 months to 30 November 2023 with a comparison to the same period in the previous 2 years.

6 months to
30 Nov 2023
Same period 2022 Same period 2021
Rank 46 59 29
Rank change year-on-year +13 -30 -3
Permanent jobs citing Linux 465 865 1,241
As % of all permanent jobs advertised in the North of England 5.90% 5.09% 7.40%
As % of the Operating Systems category 36.93% 30.30% 39.11%
Number of salaries quoted 317 553 1,008
10th Percentile £38,084 £31,250 £32,500
25th Percentile £45,000 £40,000 £38,750
Median annual salary (50th Percentile) £55,000 £55,000 £50,000
Median % change year-on-year - +10.00% +2.04%
75th Percentile £69,800 £72,500 £62,500
90th Percentile £83,750 £87,500 £68,750
England median annual salary £60,000 £62,500 £60,000
% change year-on-year -4.00% +4.17% +9.09%

All Operating Systems
North of England

Linux is in the Operating Systems category. The following table is for comparison with the above and provides summary statistics for all permanent job vacancies advertised in the North of England with a requirement for operating system skills.

Permanent vacancies with a requirement for operating system skills 1,259 2,855 3,173
As % of all permanent jobs advertised in the North of England 15.98% 16.79% 18.92%
Number of salaries quoted 977 1,782 2,586
10th Percentile £26,250 £24,250 £24,250
25th Percentile £31,125 £29,813 £31,500
Median annual salary (50th Percentile) £45,000 £42,500 £45,000
Median % change year-on-year +5.88% -5.56% -
75th Percentile £62,500 £60,000 £57,500
90th Percentile £77,900 £76,250 £67,500
England median annual salary £50,000 £52,500 £50,000
% change year-on-year -4.76% +5.00% -

Linux
Job Vacancy Trend in the North of England

Job postings citing Linux as a proportion of all IT jobs advertised in the North of England.
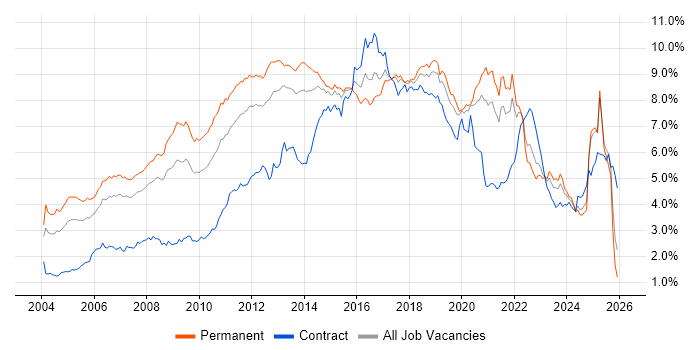
Job vacancy trend for Linux in the North of England

Linux
Salary Trend in the North of England

3-month moving average salary quoted in jobs citing Linux in the North of England.

Salary trend for Linux in the North of England

Linux
Salary Histogram in the North of England

Salary distribution for jobs citing Linux in the North of England over the 6 months to 30 November 2023.

Salary histogram for Linux in the North of England

Linux
Job Locations in the North of England

The table below looks at the demand and provides a guide to the median salaries quoted in IT jobs citing Linux within the North of England region over the 6 months to 30 November 2023. The 'Rank Change' column provides an indication of the change in demand within each location based on the same 6 month period last year.

Location Rank Change
on Same Period
Last Year
Matching
Permanent
IT Job Ads
Median Salary
Past 6 Months
Median Salary
% Change
on Same Period
Last Year
Live
Jobs
North West +29 274 £60,000 +9.09% 120
Yorkshire +3 176 £55,000 - 87
North East -8 14 £61,250 +53.13% 22
Linux
England

Linux
Co-occurring Skills and Capabilities in the North of England by Category

The follow tables expand on the table above by listing co-occurrences grouped by category. The same employment type, locality and period is covered with up to 20 co-occurrences shown in each of the following categories:

Application Platforms
1 21 (4.52%) Confluence
2 13 (2.80%) Apache
3 10 (2.15%) Captiva
3 10 (2.15%) FileNet
3 10 (2.15%) WebSphere
4 8 (1.72%) nginx
5 7 (1.51%) IIS
5 7 (1.51%) SharePoint
5 7 (1.51%) WebLogic
6 6 (1.29%) Oracle SOA Suite
6 6 (1.29%) Tomcat
7 2 (0.43%) ColdFusion
7 2 (0.43%) Drupal
7 2 (0.43%) MS Exchange
8 1 (0.22%) Moodle
8 1 (0.22%) NetWeaver
8 1 (0.22%) OpenStack
Applications
1 3 (0.65%) Microsoft Office
Business Applications
1 6 (1.29%) Exstream
2 1 (0.22%) SAP S/4HANA
Cloud Services
1 190 (40.86%) AWS
2 147 (31.61%) Azure
3 90 (19.35%) GCP
4 47 (10.11%) SaaS
5 45 (9.68%) OpenShift
6 44 (9.46%) Serverless
7 33 (7.10%) IaaS
7 33 (7.10%) PaaS
8 30 (6.45%) AWS CloudFormation
9 27 (5.81%) Microsoft 365
10 26 (5.59%) Amazon EC2
11 22 (4.73%) GitHub
12 19 (4.09%) Amazon S3
13 16 (3.44%) Cloud Computing
14 14 (3.01%) AWS Lambda
15 13 (2.80%) Azure DevOps
16 12 (2.58%) Amazon CloudWatch
17 11 (2.37%) Route 53
18 10 (2.15%) Amazon ECS
18 10 (2.15%) Amazon EKS
Communications & Networking
1 47 (10.11%) Firewall
2 34 (7.31%) TCP/IP
3 32 (6.88%) DNS
4 20 (4.30%) SAN
5 16 (3.44%) DHCP
5 16 (3.44%) HTTP
5 16 (3.44%) VPN
6 15 (3.23%) Wireless
7 13 (2.80%) F5 BIG-IP GTM
7 13 (2.80%) F5 BIG-IP LTM
8 11 (2.37%) Internet
8 11 (2.37%) LAN
9 9 (1.94%) FTP
9 9 (1.94%) VLAN
9 9 (1.94%) WAN
10 8 (1.72%) Network Security
10 8 (1.72%) VoIP
11 7 (1.51%) Intrusion Detection
11 7 (1.51%) IPv4
11 7 (1.51%) Software-Defined Radio
Database & Business Intelligence
1 47 (10.11%) MySQL
2 32 (6.88%) PostgreSQL
3 22 (4.73%) Relational Database
4 20 (4.30%) Amazon RDS
5 18 (3.87%) Redis
6 17 (3.66%) SQL Server
7 13 (2.80%) Elasticsearch
7 13 (2.80%) RDBMS
8 11 (2.37%) NoSQL
9 10 (2.15%) Data Warehouse
10 9 (1.94%) MongoDB
11 7 (1.51%) MariaDB
11 7 (1.51%) OLTP
11 7 (1.51%) Oracle Database
11 7 (1.51%) Oracle Reports
12 6 (1.29%) Oracle ODI
12 6 (1.29%) Power BI
13 4 (0.86%) BigQuery
13 4 (0.86%) Data Lake
13 4 (0.86%) InfluxDB
Development Applications
1 56 (12.04%) Jenkins
2 48 (10.32%) Git
3 42 (9.03%) JIRA
4 33 (7.10%) GitLab
5 22 (4.73%) SonarQube
6 16 (3.44%) Oracle Forms
7 13 (2.80%) Maven
8 8 (1.72%) Artifactory
9 7 (1.51%) CircleCI
9 7 (1.51%) SoapUI
10 6 (1.29%) Bitbucket
10 6 (1.29%) IBM UrbanCode
11 5 (1.08%) GoogleTest
12 4 (0.86%) Atlassian Bamboo
12 4 (0.86%) CMake
12 4 (0.86%) GDB
13 3 (0.65%) Selenium
13 3 (0.65%) Travis CI
13 3 (0.65%) Vagrant
14 2 (0.43%) Octopus Deploy
General
1 120 (25.81%) Social Skills
2 78 (16.77%) Finance
3 55 (11.83%) Banking
4 39 (8.39%) Analytical Skills
5 31 (6.67%) Inclusion and Diversity
5 31 (6.67%) Retail
6 23 (4.95%) Presentation Skills
7 21 (4.52%) Organisational Skills
8 19 (4.09%) Law
9 18 (3.87%) Aerospace
10 16 (3.44%) Public Sector
11 14 (3.01%) Games
12 10 (2.15%) Automotive
12 10 (2.15%) Manufacturing
13 6 (1.29%) Electronics
13 6 (1.29%) Marketing
14 5 (1.08%) Back Office
14 5 (1.08%) Telecoms
15 3 (0.65%) Influencing Skills
15 3 (0.65%) Retail Banking
Job Titles
1 85 (18.28%) Senior
2 75 (16.13%) DevOps Engineer
3 69 (14.84%) Software Engineer
4 61 (13.12%) Developer
5 40 (8.60%) Architect
6 39 (8.39%) Infrastructure Engineer
6 39 (8.39%) Lead
7 26 (5.59%) Senior Software Engineer
8 25 (5.38%) Infrastructure Architect
9 21 (4.52%) Cloud Engineer
9 21 (4.52%) Software Developer
10 20 (4.30%) Linux Engineer
11 18 (3.87%) Administrator
11 18 (3.87%) DBA
11 18 (3.87%) DV Cleared Software Engineer
11 18 (3.87%) Senior DevOps
11 18 (3.87%) Senior DevOps Engineer
12 17 (3.66%) Analyst
12 17 (3.66%) AWS Engineer
13 14 (3.01%) AWS DevOps
Libraries, Frameworks & Software Standards
1 46 (9.89%) Node.js
2 34 (7.31%) .NET
3 20 (4.30%) HTML
3 20 (4.30%) REST
4 18 (3.87%) Elastic Stack
4 18 (3.87%) React
5 17 (3.66%) CSS
5 17 (3.66%) XML
6 16 (3.44%) JSON
6 16 (3.44%) Spring
7 13 (2.80%) Spine.js
8 12 (2.58%) Spring Boot
9 11 (2.37%) LAMP
10 10 (2.15%) Django
11 9 (1.94%) AngularJS
11 9 (1.94%) LDAP
12 8 (1.72%) EDI
12 8 (1.72%) Ruby on Rails
12 8 (1.72%) Sidekiq
12 8 (1.72%) Unreal Engine
Miscellaneous
1 39 (8.39%) Data Centre
2 33 (7.10%) Linux Command Line
2 33 (7.10%) Private Cloud
2 33 (7.10%) Public Cloud
3 30 (6.45%) Self-Motivation
4 25 (5.38%) Cyberattack
5 24 (5.16%) Cloud Native
6 15 (3.23%) Distributed Systems
7 13 (2.80%) Hybrid Cloud
7 13 (2.80%) Mainframe
7 13 (2.80%) Replication
8 12 (2.58%) Virtual Team
9 11 (2.37%) Embedded Systems
9 11 (2.37%) Management Information System
10 10 (2.15%) DataPower
11 9 (1.94%) FPGA
12 8 (1.72%) Algorithms
13 7 (1.51%) Mali
13 7 (1.51%) Smartphone
13 7 (1.51%) VHDL
Operating Systems
1 160 (34.41%) Windows
2 83 (17.85%) Unix
3 31 (6.67%) Red Hat Enterprise Linux
4 23 (4.95%) Ubuntu
4 23 (4.95%) Windows Server
5 15 (3.23%) Android
6 14 (3.01%) CentOS
6 14 (3.01%) Debian
6 14 (3.01%) Mac OS
7 12 (2.58%) Solaris
8 11 (2.37%) Embedded Linux
9 6 (1.29%) HPUX
9 6 (1.29%) Windows Server 2012
10 5 (1.08%) FreeRTOS
11 3 (0.65%) CoreOS
11 3 (0.65%) zOS
12 2 (0.43%) Apple iOS
12 2 (0.43%) VMS
12 2 (0.43%) Windows Server 2016
12 2 (0.43%) Windows Server 2019
Processes & Methodologies
1 160 (34.41%) Agile
2 139 (29.89%) DevOps
3 132 (28.39%) CI/CD
4 122 (26.24%) Software Engineering
5 80 (17.20%) Infrastructure as Code
6 72 (15.48%) Containerisation
7 70 (15.05%) Mentoring
7 70 (15.05%) Microservices
8 60 (12.90%) Problem-Solving
9 59 (12.69%) Actionable Insight
9 59 (12.69%) Configuration Management
10 47 (10.11%) Scrum
11 41 (8.82%) Infrastructure Engineering
12 40 (8.60%) Continuous Integration
13 35 (7.53%) Design Patterns
14 34 (7.31%) User Experience
15 32 (6.88%) Cybersecurity
15 32 (6.88%) Machine Learning
15 32 (6.88%) Site Reliability Engineering
16 29 (6.24%) Problem Management
Programming Languages
1 219 (47.10%) Python
2 147 (31.61%) Java
3 81 (17.42%) Bash
4 70 (15.05%) JavaScript
5 68 (14.62%) C++
6 51 (10.97%) SQL
7 47 (10.11%) PowerShell
8 38 (8.17%) Go
9 34 (7.31%) C
10 33 (7.10%) Rust
11 28 (6.02%) PHP
12 26 (5.59%) Ruby
13 24 (5.16%) Shell Script
14 20 (4.30%) Perl
15 17 (3.66%) C#
16 14 (3.01%) TypeScript
17 12 (2.58%) MATLAB
18 5 (1.08%) Groovy
19 4 (0.86%) PL/SQL
19 4 (0.86%) Scala
Qualifications
1 102 (21.94%) Security Cleared
2 53 (11.40%) DV Cleared
3 42 (9.03%) Degree
4 41 (8.82%) SC Cleared
5 29 (6.24%) AWS Certification
6 24 (5.16%) AWS Certified Cloud Practitioner
7 23 (4.95%) AWS Certified Developer
7 23 (4.95%) AWS Certified Solutions Architect
8 14 (3.01%) Computer Science Degree
9 8 (1.72%) RHCE
10 7 (1.51%) GIAC
10 7 (1.51%) PhD
11 6 (1.29%) Cisco Certification
12 3 (0.65%) Azure Certification
12 3 (0.65%) CCNA
12 3 (0.65%) CCNP
12 3 (0.65%) CEH
12 3 (0.65%) ISTQB
12 3 (0.65%) ITIL Certification
12 3 (0.65%) Microsoft Certification
Quality Assurance & Compliance
1 32 (6.88%) QA
2 10 (2.15%) GDPR
3 7 (1.51%) ISO/IEC 27001
4 4 (0.86%) NIST
5 2 (0.43%) Cyber Essentials
5 2 (0.43%) PCI DSS
5 2 (0.43%) SLA
6 1 (0.22%) GRC
6 1 (0.22%) NCSC
6 1 (0.22%) NIST 800
System Software
1 118 (25.38%) Docker
2 50 (10.75%) VMware Infrastructure
3 35 (7.53%) Active Directory
4 24 (5.16%) Hyper-V
5 12 (2.58%) Firmware
6 6 (1.29%) Embedded Firmware
6 6 (1.29%) LXC
7 4 (0.86%) Kamailio
7 4 (0.86%) KVM
7 4 (0.86%) Virtual Desktop
8 3 (0.65%) Citrix Hypervisor
8 3 (0.65%) NFS
8 3 (0.65%) Oracle RAC
8 3 (0.65%) Slurm Workload Manager
8 3 (0.65%) Virtual Machines
8 3 (0.65%) VMware ESXi
8 3 (0.65%) vSphere
9 2 (0.43%) Terminal Services
9 2 (0.43%) VMware Server
9 2 (0.43%) XenDesktop
Systems Management
1 126 (27.10%) Ansible
2 118 (25.38%) Terraform
3 99 (21.29%) Kubernetes
4 43 (9.25%) Puppet
5 21 (4.52%) Grafana
6 19 (4.09%) Prometheus
7 15 (3.23%) Progress Chef
8 10 (2.15%) Nagios
9 6 (1.29%) ZABBIX
10 5 (1.08%) Microsoft Intune
11 4 (0.86%) EMC NetWorker
11 4 (0.86%) Kustomize
11 4 (0.86%) SCCM
11 4 (0.86%) SCOM
11 4 (0.86%) Single Sign-On
12 3 (0.65%) CA Endevor
12 3 (0.65%) Cacti
12 3 (0.65%) Data Guard
12 3 (0.65%) Ganglia
12 3 (0.65%) systemd
Vendors
1 59 (12.69%) VMware
2 52 (11.18%) Oracle
3 43 (9.25%) Microsoft
4 42 (9.03%) Red Hat
5 27 (5.81%) Cisco
6 25 (5.38%) IBM
7 23 (4.95%) ServiceNow
8 20 (4.30%) Google
9 16 (3.44%) Splunk
10 15 (3.23%) CheckPoint
10 15 (3.23%) F5
10 15 (3.23%) Fortinet
11 12 (2.58%) SAP
12 10 (2.15%) Kofax
12 10 (2.15%) Pega
13 7 (1.51%) Citrix
14 6 (1.29%) HP
14 6 (1.29%) Hyperion
14 6 (1.29%) Sun
14 6 (1.29%) Unisys