Azure Jobs in the South West

Microsoft Azure
England > South West

The table below provides summary statistics for permanent job vacancies advertised in the South West requiring Azure skills. It includes a benchmarking guide to the annual salaries offered in vacancies that cited Azure over the 6 months leading up to 30 May 2025, comparing them to the same period in the previous two years.

6 months to
30 May 2025
Same period 2024 Same period 2023
Rank 11 7 4
Rank change year-on-year -4 -3 +2
Permanent jobs citing Azure 415 1,427 1,406
As % of all permanent jobs advertised in the South West 11.79% 14.61% 20.93%
As % of the Cloud Services category 47.87% 51.76% 53.60%
Number of salaries quoted 340 1,051 773
10th Percentile £29,975 £32,500 £31,680
25th Percentile £37,500 £41,500 £40,000
Median annual salary (50th Percentile) £54,430 £55,000 £55,000
Median % change year-on-year -1.04% - +10.00%
75th Percentile £68,750 £68,750 £71,250
90th Percentile £90,000 £77,500 £85,000
England median annual salary £62,500 £59,000 £65,000
% change year-on-year +5.93% -9.23% +4.00%

All Cloud Skills
South West

Azure falls under the Cloud Services category. For comparison with the information above, the following table provides summary statistics for all permanent job vacancies requiring cloud computing skills in the South West.

Permanent vacancies with a requirement for cloud computing skills 867 2,757 2,623
As % of all permanent jobs advertised in the South West 24.63% 28.23% 39.04%
Number of salaries quoted 681 2,131 1,619
10th Percentile £29,750 £28,833 £30,500
25th Percentile £37,500 £37,500 £38,750
Median annual salary (50th Percentile) £55,000 £52,500 £55,000
Median % change year-on-year +4.76% -4.55% +4.76%
75th Percentile £70,000 £68,750 £70,000
90th Percentile £87,500 £82,500 £84,011
England median annual salary £60,000 £57,500 £65,000
% change year-on-year +4.35% -11.54% +4.00%

Azure
Job Vacancy Trend in the South West

Job postings citing Azure as a proportion of all IT jobs advertised in the South West.
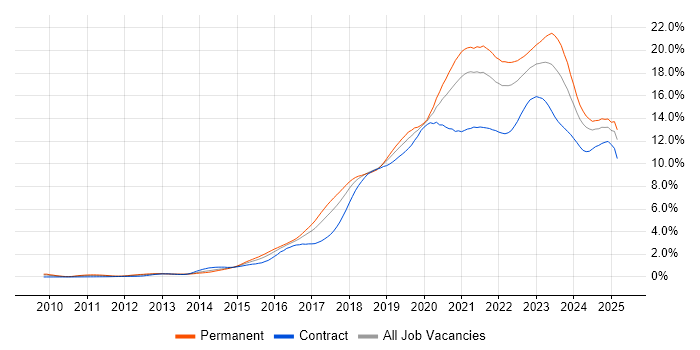
Job vacancy trend for Azure in the South West

Azure
Salary Trend in the South West

3-month moving average salary quoted in jobs citing Azure in the South West.

Salary trend for Azure in the South West

Azure
Salary Histogram in the South West

Salary distribution for jobs citing Azure in the South West over the 6 months to 30 May 2025.

Salary histogram for Azure in the South West

Azure
Job Locations in the South West

The table below looks at the demand and provides a guide to the median salaries quoted in IT jobs citing Azure within the South West region over the 6 months to 30 May 2025. The 'Rank Change' column provides an indication of the change in demand within each location based on the same 6 month period last year.

Location Rank Change
on Same Period
Last Year
Matching
Permanent
IT Job Ads
Median Salary
Past 6 Months
Median Salary
% Change
on Same Period
Last Year
Live
Jobs
Bristol -6 164 £62,500 +8.70% 320
Wiltshire -1 66 £55,000 -8.33% 230
Somerset -4 61 £47,500 -5.00% 301
Devon -9 46 £32,500 -31.58% 425
Dorset -8 36 £32,500 -35.00% 221
Gloucestershire -32 34 £50,000 -4.76% 453
Cornwall +1 6 £30,625 +4.70% 1
Azure
England

Azure
Co-occurring Skills and Capabilities in the South West by Category

The follow tables expand on the table above by listing co-occurrences grouped by category. The same employment type, locality and period is covered with up to 20 co-occurrences shown in each of the following categories:

Application Platforms
1 43 (10.36%) Microsoft Exchange
2 24 (5.78%) SharePoint
3 11 (2.65%) IIS
4 5 (1.20%) Apache Airflow
5 4 (0.96%) Confluence
6 2 (0.48%) Apache
6 2 (0.48%) ArcGIS
6 2 (0.48%) BizTalk Server
6 2 (0.48%) CMS
6 2 (0.48%) NServiceBus
6 2 (0.48%) Umbraco
7 1 (0.24%) Apache Spark
7 1 (0.24%) Drupal
7 1 (0.24%) Joomla!
7 1 (0.24%) Luigi
7 1 (0.24%) SharePoint Server
7 1 (0.24%) WordPress
Applications
1 19 (4.58%) Microsoft Excel
1 19 (4.58%) Microsoft PowerPoint
2 17 (4.10%) Microsoft Office
3 1 (0.24%) Microsoft Project
Business Applications
1 8 (1.93%) Dynamics CRM
2 5 (1.20%) Dynamics NAV
3 2 (0.48%) Dynamics AX
4 1 (0.24%) Magento
4 1 (0.24%) SAP S/4HANA
Cloud Services
1 151 (36.39%) AWS
2 120 (28.92%) Microsoft 365
3 63 (15.18%) Power Platform
4 58 (13.98%) GCP
5 56 (13.49%) Entra ID
6 46 (11.08%) Azure DevOps
7 24 (5.78%) OneDrive
8 23 (5.54%) SaaS
8 23 (5.54%) Serverless
9 16 (3.86%) GitHub
10 14 (3.37%) Azure Logic Apps
10 14 (3.37%) Power Automate
11 13 (3.13%) Dynamics 365
11 13 (3.13%) PaaS
12 12 (2.89%) Azure Data Factory
12 12 (2.89%) Cloud Computing
13 11 (2.65%) Azure Service Bus
13 11 (2.65%) npm
14 10 (2.41%) AWS Lambda
14 10 (2.41%) Snowflake
Communications & Networking
1 94 (22.65%) Firewall
2 49 (11.81%) DNS
3 39 (9.40%) WAN
4 35 (8.43%) VPN
5 30 (7.23%) DHCP
5 30 (7.23%) VLAN
6 28 (6.75%) LAN
7 18 (4.34%) Network Security
7 18 (4.34%) Wi-Fi
8 16 (3.86%) VoIP
9 12 (2.89%) SD-WAN
10 11 (2.65%) SAN
11 10 (2.41%) ADSL
12 8 (1.93%) OSPF
13 7 (1.69%) Broadband
13 7 (1.69%) EIGRP
14 6 (1.45%) RIP
14 6 (1.45%) SNMP
14 6 (1.45%) SSH
14 6 (1.45%) Wireless
Database & Business Intelligence
1 53 (12.77%) Power BI
2 38 (9.16%) SQL Server
3 21 (5.06%) Data Warehouse
4 18 (4.34%) Amazon RDS
4 18 (4.34%) NoSQL
5 17 (4.10%) Data Mining
6 16 (3.86%) BusinessObjects
7 14 (3.37%) PostgreSQL
8 13 (3.13%) Tableau
9 12 (2.89%) SQL Server Integration Services
10 11 (2.65%) Data Lake
10 11 (2.65%) Relational Database
10 11 (2.65%) SQL Server Reporting Services
11 9 (2.17%) BigQuery
12 8 (1.93%) Azure SQL Database
12 8 (1.93%) MongoDB
13 7 (1.69%) SQL Server Analysis Services
14 6 (1.45%) MySQL
15 5 (1.20%) Big Data
15 5 (1.20%) Looker
Development Applications
1 50 (12.05%) Git
2 19 (4.58%) JIRA
3 15 (3.61%) Cypress.io
4 13 (3.13%) Cucumber
4 13 (3.13%) GitLab
5 11 (2.65%) Sonatype Nexus
5 11 (2.65%) webpack
6 9 (2.17%) Jenkins
6 9 (2.17%) Postman
7 8 (1.93%) Selenium
7 8 (1.93%) Visual Studio
8 5 (1.20%) Subversion
8 5 (1.20%) Visual Studio Code
9 3 (0.72%) SonarQube
9 3 (0.72%) Team Foundation Server
10 2 (0.48%) Fiddler
10 2 (0.48%) Gatling
10 2 (0.48%) SQL Server Management Studio (SSMS)
10 2 (0.48%) TeamCity
10 2 (0.48%) Zephyr
General
1 109 (26.27%) Social Skills
2 93 (22.41%) Finance
3 63 (15.18%) Analytical Skills
4 50 (12.05%) Retail
5 37 (8.92%) Banking
6 21 (5.06%) Manufacturing
6 21 (5.06%) Public Sector
7 14 (3.37%) Legal
8 12 (2.89%) Inclusion and Diversity
9 11 (2.65%) Influencing Skills
10 9 (2.17%) Electronics
10 9 (2.17%) Games
11 8 (1.93%) Marketing
12 6 (1.45%) Law
12 6 (1.45%) Police
13 5 (1.20%) Aerospace
13 5 (1.20%) Documentation Skills
14 4 (0.96%) Automotive
15 2 (0.48%) Advertising
15 2 (0.48%) Telecoms
Job Titles
1 87 (20.96%) Developer
2 52 (12.53%) 2nd Line Support
2 52 (12.53%) IT Support
3 51 (12.29%) Senior
4 50 (12.05%) Lead
5 48 (11.57%) Analyst
6 36 (8.67%) Software Engineer
7 33 (7.95%) Support Analyst
8 26 (6.27%) Architect
9 24 (5.78%) Support Engineer
10 20 (4.82%) IT Engineer
11 19 (4.58%) 2nd Line Support Analyst
11 19 (4.58%) IT Analyst
12 18 (4.34%) Data Engineer
12 18 (4.34%) IT Support Analyst
13 17 (4.10%) Support Technician
14 16 (3.86%) 3rd Line Support
14 16 (3.86%) Junior
14 16 (3.86%) Junior Developer
14 16 (3.86%) Software Developer
Libraries, Frameworks & Software Standards
1 49 (11.81%) React
2 44 (10.60%) .NET
3 36 (8.67%) RESTful
4 34 (8.19%) AngularJS
5 23 (5.54%) Spring Boot
6 20 (4.82%) Web Services
7 18 (4.34%) .NET Core
7 18 (4.34%) .NET Framework
7 18 (4.34%) HTML
8 17 (4.10%) CSS
8 17 (4.10%) Node.js
9 16 (3.86%) REST
10 15 (3.61%) JSON
11 14 (3.37%) ASP.NET
12 11 (2.65%) Entity Framework
12 11 (2.65%) Jest
12 11 (2.65%) Spring
12 11 (2.65%) Vue
13 10 (2.41%) XML
14 9 (2.17%) Tailwind CSS
Miscellaneous
1 27 (6.51%) Data Structures
2 22 (5.30%) Driving Licence
3 16 (3.86%) Cloud Native
3 16 (3.86%) Legacy Systems
4 14 (3.37%) Product Ownership
5 13 (3.13%) Management Information System
5 13 (3.13%) Private Cloud
6 12 (2.89%) Public Cloud
7 10 (2.41%) Hybrid Cloud
7 10 (2.41%) Video Conferencing
8 9 (2.17%) Self-Motivation
9 8 (1.93%) Onboarding
10 7 (1.69%) Distributed Applications
10 7 (1.69%) Reinsurance
11 6 (1.45%) Client/Server
11 6 (1.45%) DataPower
11 6 (1.45%) N-Tier
12 5 (1.20%) Algorithms
12 5 (1.20%) Cyber Threat
12 5 (1.20%) FMCG
Operating Systems
1 82 (19.76%) Windows
2 58 (13.98%) Windows Server
3 29 (6.99%) Linux
4 15 (3.61%) Apple iOS
4 15 (3.61%) Mac OS
5 11 (2.65%) Android
6 10 (2.41%) Windows Server 2016
7 9 (2.17%) Windows 10
8 8 (1.93%) Windows Server 2019
9 4 (0.96%) Windows Server 2012
10 1 (0.24%) Windows 8
Processes & Methodologies
1 132 (31.81%) Problem-Solving
2 110 (26.51%) Agile
2 110 (26.51%) DevOps
3 100 (24.10%) CI/CD
4 63 (15.18%) Software Engineering
5 60 (14.46%) Mentoring
6 52 (12.53%) Customer Service
7 50 (12.05%) Business Intelligence
8 49 (11.81%) Containerisation
9 48 (11.57%) Microservices
10 45 (10.84%) Cybersecurity
11 44 (10.60%) Data Modelling
11 44 (10.60%) ITIL
12 42 (10.12%) Analytics
13 41 (9.88%) Full-Stack Development
14 39 (9.40%) Roadmaps
14 39 (9.40%) Test Automation
15 37 (8.92%) Coaching
16 36 (8.67%) Disaster Recovery
17 32 (7.71%) Service Delivery
Programming Languages
1 107 (25.78%) SQL
2 60 (14.46%) Python
3 54 (13.01%) Java
4 50 (12.05%) JavaScript
5 47 (11.33%) C#
6 43 (10.36%) PowerShell
7 29 (6.99%) TypeScript
8 19 (4.58%) VBA
9 10 (2.41%) T-SQL
10 8 (1.93%) Bash
10 8 (1.93%) VB.NET
11 5 (1.20%) C++
11 5 (1.20%) R
12 4 (0.96%) Data Analysis Expressions
12 4 (0.96%) Go
12 4 (0.96%) Julia
12 4 (0.96%) VB
13 2 (0.48%) Bicep
13 2 (0.48%) Dart
13 2 (0.48%) XAML
Qualifications
1 55 (13.25%) Security Cleared
2 49 (11.81%) Degree
3 38 (9.16%) SC Cleared
4 35 (8.43%) Microsoft Certification
5 26 (6.27%) Network+ Certification
6 23 (5.54%) Azure Certification
7 19 (4.58%) AWS Certification
8 15 (3.61%) A+ Certification
8 15 (3.61%) MCITP
9 14 (3.37%) Cisco Certification
10 11 (2.65%) Computer Science Degree
11 10 (2.41%) CCNA
11 10 (2.41%) CISSP
11 10 (2.41%) DV Cleared
12 9 (2.17%) AWS Certified Solutions Architect
13 8 (1.93%) PhD
14 7 (1.69%) BPSS Clearance
14 7 (1.69%) DBS Check
14 7 (1.69%) MCP
15 6 (1.45%) MCSA
Quality Assurance & Compliance
1 19 (4.58%) GDPR
2 14 (3.37%) QA
3 10 (2.41%) ISO/IEC 27001
4 8 (1.93%) NIST
5 7 (1.69%) Data Quality
5 7 (1.69%) PCI DSS
6 5 (1.20%) Accessibility
7 3 (0.72%) Cyber Essentials
7 3 (0.72%) HIPAA
7 3 (0.72%) SLA
7 3 (0.72%) SOC 2
8 2 (0.48%) California Consumer Privacy Act
8 2 (0.48%) COBIT
8 2 (0.48%) Cyber Essentials PLUS
8 2 (0.48%) ISO/IEC 27002 (supersedes ISO/IEC 17799)
9 1 (0.24%) GRC
9 1 (0.24%) NCSC
System Software
1 102 (24.58%) Active Directory
2 47 (11.33%) Docker
3 37 (8.92%) VMware Infrastructure
4 16 (3.86%) Hyper-V
5 6 (1.45%) vSphere
6 4 (0.96%) Virtual Desktop
6 4 (0.96%) Virtual Machines
7 3 (0.72%) VMware ESXi
8 2 (0.48%) XenApp
9 1 (0.24%) BitLocker
9 1 (0.24%) Microsoft App-V
9 1 (0.24%) Slurm Workload Manager
9 1 (0.24%) Virtual Servers
9 1 (0.24%) VMware NSX
Systems Management
1 63 (15.18%) Microsoft Intune
2 46 (11.08%) Kubernetes
3 24 (5.78%) Terraform
4 11 (2.65%) Ansible
5 7 (1.69%) SCCM
6 6 (1.45%) Grafana
6 6 (1.45%) Prometheus
7 3 (0.72%) Active Directory Federation Services
7 3 (0.72%) FortiGate
7 3 (0.72%) Iperf
8 2 (0.48%) Host Intrusion Detection System
8 2 (0.48%) Puppet
8 2 (0.48%) Single Sign-On
8 2 (0.48%) SmoothWall
9 1 (0.24%) Nagios
9 1 (0.24%) Packer
9 1 (0.24%) Progress Chef
9 1 (0.24%) vCenter Server
Vendors
1 166 (40.00%) Microsoft
2 50 (12.05%) VMware
3 26 (6.27%) Google
4 25 (6.02%) Cisco
5 17 (4.10%) Databricks
6 15 (3.61%) Facebook
7 13 (3.13%) Fortinet
8 12 (2.89%) CheckPoint
9 10 (2.41%) IBM
9 10 (2.41%) SolarWinds
10 8 (1.93%) Apple
11 6 (1.45%) Citrix
11 6 (1.45%) F5
12 5 (1.20%) Aruba
12 5 (1.20%) Okta
12 5 (1.20%) Palo Alto
13 4 (0.96%) Extreme Networks
13 4 (0.96%) HP
13 4 (0.96%) Meraki
13 4 (0.96%) Red Hat