Oracle Jobs in Bristol

Oracle
South West > Bristol

The table below provides summary statistics for permanent job vacancies advertised in Bristol with a requirement for knowledge and experience of Oracle products and/or services. Included is a benchmarking guide to the salaries offered in vacancies that have cited Oracle over the 6 months to 3 May 2024 with a comparison to the same period in the previous 2 years.

The figures below represent the IT labour market in general and are not representative of salaries within the Oracle Corporation.

6 months to
3 May 2024
Same period 2023 Same period 2022
Rank 39 46 78
Rank change year-on-year +7 +32 -38
Permanent jobs citing Oracle 156 168 129
As % of all permanent jobs advertised in Bristol 5.03% 6.35% 3.91%
As % of the Vendors category 18.51% 17.80% 12.52%
Number of salaries quoted 109 114 69
10th Percentile £36,250 £31,998 £31,850
25th Percentile £46,250 £42,500 £37,908
Median annual salary (50th Percentile) £67,500 £56,405 £50,238
Median % change year-on-year +19.67% +12.28% +0.48%
75th Percentile £90,000 £70,000 £60,000
90th Percentile £92,047 £77,715 £75,000
South West median annual salary £60,000 £56,250 £50,000
% change year-on-year +6.67% +12.50% +2.04%

All Vendors
Bristol

Oracle is in the Vendor Products and Services category. The following table is for comparison with the above and provides summary statistics for all permanent job vacancies with a requirement for knowledge or experience of vendor products and services advertised in Bristol.

Permanent vacancies with a requirement for knowledge or experience of vendor products and services 843 944 1,030
As % of all permanent jobs advertised in Bristol 27.18% 35.66% 31.24%
Number of salaries quoted 631 534 734
10th Percentile £28,500 £27,650 £28,500
25th Percentile £36,250 £36,063 £36,000
Median annual salary (50th Percentile) £52,500 £52,500 £47,500
Median % change year-on-year - +10.53% +5.56%
75th Percentile £70,000 £70,000 £63,500
90th Percentile £82,816 £80,000 £86,750
South West median annual salary £47,657 £45,375 £46,050
% change year-on-year +5.03% -1.47% +2.33%

Oracle
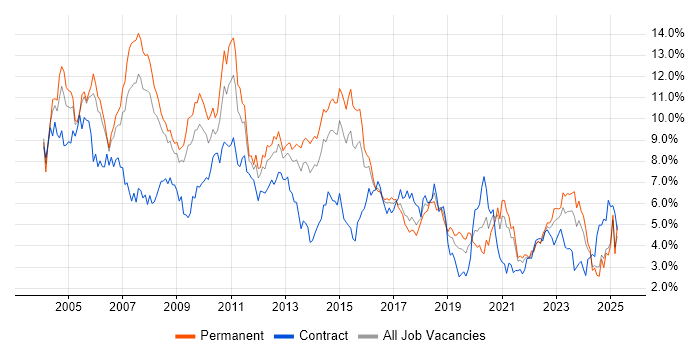
Job Vacancy Trend in Bristol

Job postings citing Oracle as a proportion of all IT jobs advertised in Bristol.

Job vacancy trend for Oracle in Bristol

Oracle
Salary Trend in Bristol

3-month moving average salary quoted in jobs citing Oracle in Bristol.

Salary trend for Oracle in Bristol

Oracle
Salary Histogram in Bristol

Salary distribution for jobs citing Oracle in Bristol over the 6 months to 3 May 2024.

Salary histogram for Oracle in Bristol

Oracle
Co-occurring Skills and Capabilities in Bristol by Category

The follow tables expand on the table above by listing co-occurrences grouped by category. The same employment type, locality and period is covered with up to 20 co-occurrences shown in each of the following categories:

Application Platforms
1 9 (5.77%) Apache Spark
2 5 (3.21%) Apache
2 5 (3.21%) Oracle Application Server
3 4 (2.56%) WebLogic
4 3 (1.92%) Captiva
4 3 (1.92%) CloudStack
4 3 (1.92%) ColdFusion
4 3 (1.92%) FileNet
4 3 (1.92%) GlassFish
4 3 (1.92%) JBoss
4 3 (1.92%) SharePoint
4 3 (1.92%) Tomcat
4 3 (1.92%) WebSphere
5 2 (1.28%) Microsoft Exchange
5 2 (1.28%) Oracle Workflow
6 1 (0.64%) Confluence
Applications
1 17 (10.90%) Microsoft Excel
2 7 (4.49%) Oracle Smart View
3 3 (1.92%) Microsoft Office
3 3 (1.92%) Microsoft Project
Business Applications
1 7 (4.49%) HFM
1 7 (4.49%) Hyperion Planning
2 4 (2.56%) Primavera
2 4 (2.56%) Sparx Enterprise Architect
3 2 (1.28%) SAP FI-GL
4 1 (0.64%) Teamcenter
Cloud Services
1 43 (27.56%) AWS
1 43 (27.56%) Azure
2 23 (14.74%) Power Platform
3 21 (13.46%) GCP
3 21 (13.46%) OCI
4 9 (5.77%) SaaS
4 9 (5.77%) Snowflake
5 6 (3.85%) Google Analytics
6 5 (3.21%) Cloud Computing
6 5 (3.21%) Serverless
7 4 (2.56%) Amazon EKS
7 4 (2.56%) Amazon SQS
7 4 (2.56%) Entra ID
8 3 (1.92%) Azure DevOps
8 3 (1.92%) GitHub
8 3 (1.92%) npm
9 2 (1.28%) AWS Lambda
9 2 (1.28%) IaaS
9 2 (1.28%) Microsoft 365
9 2 (1.28%) PaaS
Communications & Networking
1 4 (2.56%) BGP
1 4 (2.56%) DNS
1 4 (2.56%) SSL
1 4 (2.56%) TCP/IP
2 3 (1.92%) iSCSI
2 3 (1.92%) Reverse Proxy
Database & Business Intelligence
1 37 (23.72%) SQL Server
2 27 (17.31%) Oracle Database
3 25 (16.03%) Relational Database
4 23 (14.74%) Power BI
5 19 (12.18%) Tableau
6 18 (11.54%) PostgreSQL
7 16 (10.26%) Data Warehouse
8 15 (9.62%) Oracle Reports
9 13 (8.33%) Oracle BI EE
10 11 (7.05%) Oracle Database 11g
11 10 (6.41%) Data Lake
12 9 (5.77%) Hadoop
13 8 (5.13%) Big Data
13 8 (5.13%) BigQuery
13 8 (5.13%) Flink
13 8 (5.13%) RDBMS
14 7 (4.49%) Amazon RDS
14 7 (4.49%) Essbase
15 6 (3.85%) Oracle ODI
15 6 (3.85%) Star Schema
Development Applications
1 19 (12.18%) Oracle Forms
2 18 (11.54%) Git
3 7 (4.49%) Jenkins
4 6 (3.85%) Selenium
5 4 (2.56%) GitLab
5 4 (2.56%) IBM UrbanCode
5 4 (2.56%) JIRA
6 3 (1.92%) JDeveloper
6 3 (1.92%) Maven
6 3 (1.92%) Moq
6 3 (1.92%) SpecFlow
6 3 (1.92%) xUnit.net
7 1 (0.64%) Oracle APEX
General
1 56 (35.90%) Social Skills
2 50 (32.05%) Finance
3 32 (20.51%) Analytical Skills
4 17 (10.90%) Banking
4 17 (10.90%) Retail
5 11 (7.05%) Marketing
6 4 (2.56%) Presentation Skills
6 4 (2.56%) Telecoms
7 3 (1.92%) Aerospace
7 3 (1.92%) Automotive
7 3 (1.92%) Influencing Skills
8 2 (1.28%) Financial Institution
8 2 (1.28%) General Ledger
8 2 (1.28%) Publishing
9 1 (0.64%) Manufacturing
9 1 (0.64%) Public Sector
9 1 (0.64%) Tech for Good
Job Titles
1 28 (17.95%) Analyst
1 28 (17.95%) Developer
2 21 (13.46%) Lead
3 19 (12.18%) Senior
4 14 (8.97%) Software Engineer
5 12 (7.69%) Architect
5 12 (7.69%) Senior Developer
6 11 (7.05%) Database Developer
6 11 (7.05%) PostgreSQL Developer
6 11 (7.05%) Solutions Architect
7 10 (6.41%) Senior Database Developer
8 9 (5.77%) Data Analyst
8 9 (5.77%) Environment And Release Manager
8 9 (5.77%) Release Manager
9 8 (5.13%) Cloud Engineer
9 8 (5.13%) Customer Analyst
10 7 (4.49%) Consultant
11 6 (3.85%) DevOps Manager
11 6 (3.85%) Java Developer
11 6 (3.85%) Software Developer
Libraries, Frameworks & Software Standards
1 14 (8.97%) Kafka
2 13 (8.33%) Oracle Fusion
3 10 (6.41%) React
4 8 (5.13%) .NET
4 8 (5.13%) Apache Beam
4 8 (5.13%) Spring Boot
5 7 (4.49%) HTML
5 7 (4.49%) RabbitMQ
5 7 (4.49%) Spring
6 6 (3.85%) CSS
7 5 (3.21%) REST
8 4 (2.56%) ASP.NET Web Forms
8 4 (2.56%) Middleware
8 4 (2.56%) SailPoint
9 3 (1.92%) AngularJS
9 3 (1.92%) ASP.NET
9 3 (1.92%) ASP.NET Web API
9 3 (1.92%) LDAP
9 3 (1.92%) Node.js
9 3 (1.92%) SAML
Miscellaneous
1 8 (5.13%) Data Structures
1 8 (5.13%) Public Cloud
2 7 (4.49%) Algorithms
2 7 (4.49%) Private Cloud
3 6 (3.85%) Enterprise Software
3 6 (3.85%) Mobile App
4 5 (3.21%) Cloud Native
5 4 (2.56%) Management Information System
6 3 (1.92%) DataPower
6 3 (1.92%) Greenfield Project
6 3 (1.92%) Legacy Systems
7 2 (1.28%) Analytical Mindset
7 2 (1.28%) Low-Code
7 2 (1.28%) Self-Motivation
8 1 (0.64%) Blog
8 1 (0.64%) Distributed Systems
8 1 (0.64%) Product Ownership
8 1 (0.64%) Replication
8 1 (0.64%) Robotics
Operating Systems
1 19 (12.18%) Linux
2 12 (7.69%) Windows
3 7 (4.49%) Red Hat Enterprise Linux
3 7 (4.49%) Unix
4 6 (3.85%) Windows Server
5 5 (3.21%) AIX
6 3 (1.92%) Solaris
6 3 (1.92%) SUSE
6 3 (1.92%) SUSE Linux Enterprise Server
6 3 (1.92%) VMS
7 2 (1.28%) Apple iOS
7 2 (1.28%) Oracle Linux
Processes & Methodologies
1 39 (25.00%) Agile
2 30 (19.23%) Analytics
2 30 (19.23%) DevOps
3 27 (17.31%) Actionable Insight
4 26 (16.67%) Business Intelligence
5 25 (16.03%) Software Engineering
6 24 (15.38%) Migration
7 23 (14.74%) Visualisation
8 21 (13.46%) CI/CD
8 21 (13.46%) Collaborative Working
8 21 (13.46%) Problem-Solving
9 19 (12.18%) Artificial Intelligence
9 19 (12.18%) Unit Testing
10 18 (11.54%) Continuous Integration
11 17 (10.90%) Data Migration
12 15 (9.62%) Computer Science
12 15 (9.62%) Microservices
12 15 (9.62%) Performance Tuning
13 14 (8.97%) Scrum
14 12 (7.69%) Data Modelling
Programming Languages
1 64 (41.03%) SQL
2 36 (23.08%) Python
3 28 (17.95%) Java
4 21 (13.46%) PL/SQL
5 13 (8.33%) Go
5 13 (8.33%) VBA
6 9 (5.77%) Scala
7 8 (5.13%) JavaScript
8 7 (4.49%) Bash
9 6 (3.85%) Perl
10 5 (3.21%) C#
10 5 (3.21%) PHP
11 4 (2.56%) PowerShell
11 4 (2.56%) TypeScript
11 4 (2.56%) VB.NET
12 3 (1.92%) Ruby
12 3 (1.92%) Rust
13 2 (1.28%) C++
13 2 (1.28%) R
13 2 (1.28%) VB
Qualifications
1 14 (8.97%) Degree
2 8 (5.13%) SC Cleared
2 8 (5.13%) Security Cleared
3 4 (2.56%) AWS Certification
3 4 (2.56%) AWS Certified Solutions Architect
3 4 (2.56%) Azure Certification
4 2 (1.28%) CompTIA Security+
5 1 (0.64%) CBAP
5 1 (0.64%) Computer Science Degree
5 1 (0.64%) DV Cleared
5 1 (0.64%) Microsoft Certification
5 1 (0.64%) PRINCE2 Practitioner
Quality Assurance & Compliance
1 7 (4.49%) Data Quality
1 7 (4.49%) QA
2 3 (1.92%) GDPR
3 2 (1.28%) Cyber Essentials
3 2 (1.28%) ISO/IEC 27001
3 2 (1.28%) PMO
4 1 (0.64%) ISO 9001
System Software
1 24 (15.38%) Docker
2 10 (6.41%) Active Directory
3 3 (1.92%) Ceph
3 3 (1.92%) Gluster
3 3 (1.92%) KVM
3 3 (1.92%) oVirt
3 3 (1.92%) Virtual Machines
Systems Management
1 17 (10.90%) Kubernetes
2 6 (3.85%) Ansible
3 3 (1.92%) Graylog
3 3 (1.92%) Observium
3 3 (1.92%) Oracle Statspack
3 3 (1.92%) Prometheus
3 3 (1.92%) Puppet
3 3 (1.92%) Single Sign-On
3 3 (1.92%) ZABBIX
4 2 (1.28%) CASB
4 2 (1.28%) Microsoft Intune
4 2 (1.28%) PingFederate
Vendors
1 32 (20.51%) Microsoft
2 20 (12.82%) Salesforce
3 13 (8.33%) SAP
4 10 (6.41%) Google
5 8 (5.13%) IBM
5 8 (5.13%) Teradata
6 7 (4.49%) Hyperion
7 4 (2.56%) Cognos
7 4 (2.56%) ServiceNow
7 4 (2.56%) Sparx
8 3 (1.92%) Kofax
8 3 (1.92%) New Relic
8 3 (1.92%) NGA Human Resources
8 3 (1.92%) Northgate
8 3 (1.92%) Okta
8 3 (1.92%) Pega
8 3 (1.92%) SolarWinds
9 2 (1.28%) BeyondTrust
9 2 (1.28%) Splunk
9 2 (1.28%) VMware