Security Cleared Job Trends in Cheltenham

Security Clearance
Gloucestershire > Cheltenham

The table below provides summary statistics for permanent job vacancies advertised in Cheltenham with a requirement for Security Cleared qualifications. It includes a benchmarking guide to the salaries offered over the 6 months leading up to 14 October 2026, comparing them to the same period in the previous two years.

6 months to
14 Oct 2026
Same period 2025 Same period 2024
Rank 1 1 1
Rank change year-on-year 0 0 0
Permanent jobs citing Security Cleared 332 47 127
As % of all permanent jobs in Cheltenham 35.74% 38.21% 45.68%
As % of the Qualifications category 89.97% 90.38% 88.81%
Number of salaries quoted 284 40 79
10th Percentile £55,000 £52,375 £49,000
25th Percentile £63,750 £55,938 £55,000
Median annual salary (50th Percentile) £80,000 £83,750 £67,500
Median % change year-on-year -4.48% +24.07% +16.88%
75th Percentile £100,000 £100,000 £78,750
90th Percentile £109,000 - £90,000
Gloucestershire median annual salary £80,000 £70,000 £60,000
% change year-on-year +14.29% +16.67% -

All Academic and Professional Certifications
Cheltenham

Security Cleared falls under the Academic Qualifications and Professional Certifications category. For comparison with the information above, the following table provides summary statistics for all permanent job vacancies requiring academic qualifications or professional certifications in Cheltenham.

Permanent vacancies requiring academic qualifications or professional certifications 369 52 143
As % of all permanent jobs advertised in Cheltenham 39.72% 42.28% 51.44%
Number of salaries quoted 300 44 87
10th Percentile £52,500 £49,500 £43,750
25th Percentile £60,000 £55,000 £53,125
Median annual salary (50th Percentile) £80,000 £83,750 £65,000
Median % change year-on-year -4.48% +28.85% +12.07%
75th Percentile £100,000 £100,000 £77,500
90th Percentile £109,000 - £90,000
Gloucestershire median annual salary £75,000 £65,000 £57,560
% change year-on-year +15.38% +12.93% +0.10%

Security Cleared
Job Vacancy Trend in Cheltenham

Historical trend showing the proportion of permanent IT job postings citing Security Cleared relative to all permanent IT jobs advertised in Cheltenham.

Security Cleared job vacancy trend in Cheltenham

Security Cleared
Salary Trend in Cheltenham

Salary distribution trend for jobs in Cheltenham citing Security Cleared.
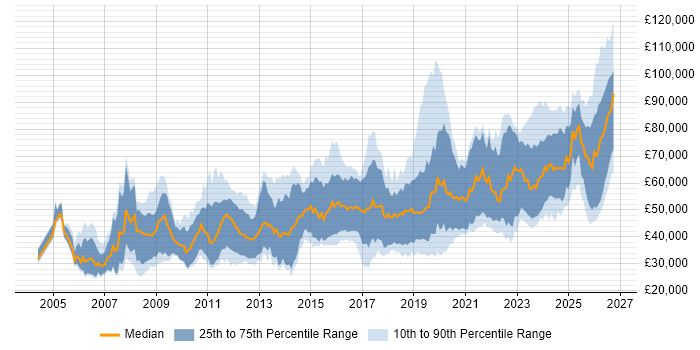
Salary distribution trend for jobs in Cheltenham citing Security Cleared

Security Cleared
Salary Histogram in Cheltenham

Salary distribution for jobs citing Security Cleared in Cheltenham over the 6 months to 14 October 2026.

Salary histogram for Security Cleared in Cheltenham

Security Cleared
Co-Occurring Skills & Capabilities in Cheltenham by Category

The following tables expand on the one above by listing co-occurrences grouped by category. They cover the same employment type, locality and period, with up to 20 co-occurrences shown in each category:

Application Platforms
1 5 (1.51%) Apache
2 4 (1.20%) Apache Spark
3 3 (0.90%) Confluence
4 1 (0.30%) Microsoft Exchange
4 1 (0.30%) OpenStack
Applications
1 3 (0.90%) Microsoft Office
2 1 (0.30%) Microsoft Excel
2 1 (0.30%) Microsoft PowerPoint
Cloud Services
1 42 (12.65%) AWS
2 33 (9.94%) Azure
3 12 (3.61%) GCP
4 11 (3.31%) OpenShift
5 10 (3.01%) GitHub
6 8 (2.41%) Amazon EC2
6 8 (2.41%) Amazon S3
6 8 (2.41%) AWS Lambda
6 8 (2.41%) Serverless
7 7 (2.11%) Microsoft 365
8 5 (1.51%) Azure DevOps
8 5 (1.51%) Azure Machine Learning
9 4 (1.20%) GitHub Actions
10 3 (0.90%) Amazon ECS
10 3 (0.90%) Amazon EKS
11 2 (0.60%) AWS CloudFormation
11 2 (0.60%) Azure Sentinel
11 2 (0.60%) Entra ID
12 1 (0.30%) Cloud Computing
12 1 (0.30%) PaaS
Communications & Networking
1 5 (1.51%) Software-Defined Radio
2 2 (0.60%) DHCP
2 2 (0.60%) DNS
2 2 (0.60%) Firewall
2 2 (0.60%) TCP/IP
3 1 (0.30%) Fibre Channel
3 1 (0.30%) LAN
3 1 (0.30%) MPLS
3 1 (0.30%) Network Security
3 1 (0.30%) VSAN
3 1 (0.30%) WAN
Database & Business Intelligence
1 10 (3.01%) NoSQL
2 8 (2.41%) Amazon RDS
3 5 (1.51%) Big Data
3 5 (1.51%) Flink
4 4 (1.20%) Amazon Athena
4 4 (1.20%) Amazon Redshift
4 4 (1.20%) PostgreSQL
4 4 (1.20%) Redis
5 3 (0.90%) Data Warehouse
5 3 (0.90%) Metadata
6 1 (0.30%) SQL Server
Development Applications
1 14 (4.22%) Git
2 12 (3.61%) GitLab
2 12 (3.61%) Jenkins
3 7 (2.11%) Cypress.io
4 6 (1.81%) JIRA
5 5 (1.51%) REST Assured
5 5 (1.51%) Selenium
6 2 (0.60%) TestRail
6 2 (0.60%) Valgrind
6 2 (0.60%) Zephyr
7 1 (0.30%) Gradle
7 1 (0.30%) JUnit
7 1 (0.30%) MLflow
7 1 (0.30%) Mockito
General
1 22 (6.63%) Public Sector
1 22 (6.63%) Social Skills
2 16 (4.82%) Analytical Skills
2 16 (4.82%) Finance
3 14 (4.22%) Aerospace
4 6 (1.81%) Organisational Skills
5 1 (0.30%) Documentation Skills
Job Titles
1 58 (17.47%) Software Engineer
2 47 (14.16%) Developer
3 38 (11.45%) Lead
4 35 (10.54%) Software Developer
5 28 (8.43%) Senior
6 26 (7.83%) DevOps Engineer
7 24 (7.23%) Architect
8 23 (6.93%) Principal Engineer
9 20 (6.02%) C++ Developer
9 20 (6.02%) C++ Software Developer
10 19 (5.72%) Cloud Engineer
11 18 (5.42%) Data Engineer
12 17 (5.12%) Analyst
12 17 (5.12%) Lead DevOps
13 16 (4.82%) Java Developer
14 15 (4.52%) Data Architect
14 15 (4.52%) Lead DevOps Engineer
15 14 (4.22%) Business Analyst
15 14 (4.22%) Consultant
15 14 (4.22%) Infrastructure Engineer
Libraries, Frameworks & Software Standards
1 36 (10.84%) Terraform
2 12 (3.61%) Spring
2 12 (3.61%) Spring Boot
3 9 (2.71%) Node.js
4 7 (2.11%) Playwright
4 7 (2.11%) REST
4 7 (2.11%) RESTful
5 6 (1.81%) Kafka
6 2 (0.60%) Backbone.js
6 2 (0.60%) Next.js
6 2 (0.60%) React
7 1 (0.30%) Android Jetpack
7 1 (0.30%) FastAPI
7 1 (0.30%) gRPC
7 1 (0.30%) Jetpack Compose
7 1 (0.30%) MEAN Stack
7 1 (0.30%) OpenAPI
7 1 (0.30%) Plotly
7 1 (0.30%) PyTorch
7 1 (0.30%) TensorFlow
Miscellaneous
1 21 (6.33%) Cloud Native
2 11 (3.31%) Distributed Systems
2 11 (3.31%) Public Cloud
3 6 (1.81%) Distributed Applications
4 5 (1.51%) Data Structures
5 4 (1.20%) Mobile App
6 3 (0.90%) Analytical Mindset
6 3 (0.90%) Embedded Systems
6 3 (0.90%) Security Posture
7 2 (0.60%) Cloud Security Posture
7 2 (0.60%) Legacy Code
8 1 (0.30%) Algorithms
8 1 (0.30%) Data Protection Act
8 1 (0.30%) Hybrid Cloud
8 1 (0.30%) Legacy Systems
8 1 (0.30%) Operational Technology
8 1 (0.30%) Private Cloud
8 1 (0.30%) Product Ownership
8 1 (0.30%) Smartphone
8 1 (0.30%) Social Media
Operating Systems
1 58 (17.47%) Linux
2 12 (3.61%) Android
3 10 (3.01%) Windows
4 2 (0.60%) Apple iOS
4 2 (0.60%) Unix
5 1 (0.30%) CentOS
5 1 (0.30%) CoreOS
5 1 (0.30%) Red Hat Enterprise Linux
5 1 (0.30%) Windows Server
5 1 (0.30%) Windows Server 2016
5 1 (0.30%) Windows Server 2019
Processes & Methodologies
1 77 (23.19%) Software Engineering
2 63 (18.98%) CI/CD
2 63 (18.98%) DevOps
3 48 (14.46%) Agile
4 40 (12.05%) Containerisation
5 32 (9.64%) Stakeholder Management
6 31 (9.34%) Infrastructure as Code
6 31 (9.34%) Infrastructure Engineering
6 31 (9.34%) Test Automation
7 29 (8.73%) Problem-Solving
8 25 (7.53%) Microservices
9 24 (7.23%) Open Source
10 21 (6.33%) AI
10 21 (6.33%) Continuous Improvement
11 19 (5.72%) Cybersecurity
11 19 (5.72%) Data Science
11 19 (5.72%) Project Management
12 18 (5.42%) DevSecOps
12 18 (5.42%) Mentoring
13 15 (4.52%) Customer Engagement
Programming Languages
1 71 (21.39%) C++
2 62 (18.67%) Java
3 45 (13.55%) Python
4 19 (5.72%) JavaScript
5 15 (4.52%) Rust
6 14 (4.22%) Bash
7 11 (3.31%) Scala
8 8 (2.41%) C
9 7 (2.11%) PowerShell
9 7 (2.11%) TypeScript
10 6 (1.81%) Kotlin
11 5 (1.51%) Go
12 2 (0.60%) C#
13 1 (0.30%) Objective-C
13 1 (0.30%) SQL
Qualifications
1 197 (59.34%) DV Cleared
2 132 (39.76%) SC Cleared
3 18 (5.42%) Degree
4 10 (3.01%) Computer Science Degree
5 2 (0.60%) CISSP
5 2 (0.60%) ISTQB
5 2 (0.60%) Microsoft Certification
6 1 (0.30%) AWS Certification
6 1 (0.30%) Azure Certification
6 1 (0.30%) BPSS Clearance
6 1 (0.30%) CHECK Team Member
6 1 (0.30%) CISA
6 1 (0.30%) CISM
6 1 (0.30%) CREST Certified
Quality Assurance & Compliance
1 14 (4.22%) QA
2 5 (1.51%) GDPR
3 4 (1.20%) Accessibility
3 4 (1.20%) ISO/IEC 27001
4 2 (0.60%) NCSC
4 2 (0.60%) NIST
5 1 (0.30%) ISO/IEC 20000
5 1 (0.30%) JSP 440
5 1 (0.30%) NIST 800
5 1 (0.30%) PCI DSS
5 1 (0.30%) PMO
System Software
1 35 (10.54%) Docker
2 6 (1.81%) VMware Infrastructure
3 4 (1.20%) VMware ESXi
3 4 (1.20%) VMware NSX
4 3 (0.90%) Active Directory
5 1 (0.30%) Hyper-V
5 1 (0.30%) vSphere
5 1 (0.30%) XenApp
5 1 (0.30%) XenDesktop
Systems Management
1 41 (12.35%) Kubernetes
2 27 (8.13%) Ansible
3 4 (1.20%) Packer
3 4 (1.20%) Puppet
3 4 (1.20%) vCenter Server
4 3 (0.90%) Microsoft Intune
5 1 (0.30%) Kubeflow
5 1 (0.30%) McAfee ePO
5 1 (0.30%) SCVMM
5 1 (0.30%) Single Sign-On
Vendors
1 21 (6.33%) Microsoft
2 13 (3.92%) VMware
3 5 (1.51%) Atlassian
4 4 (1.20%) Databricks
5 3 (0.90%) Google
6 2 (0.60%) Citrix
7 1 (0.30%) Cisco
7 1 (0.30%) Dell
7 1 (0.30%) Foundry
7 1 (0.30%) McAfee
7 1 (0.30%) NetApp
7 1 (0.30%) Red Hat
7 1 (0.30%) Splunk