SC Cleared Jobs in Scotland

Security Check (SC) Clearance
UK > Scotland

The table below provides summary statistics for permanent job vacancies advertised in Scotland with a requirement for SC Cleared qualifications. It includes a benchmarking guide to the salaries offered over the 6 months leading up to 26 July 2024, comparing them to the same period in the previous two years.

6 months to
26 Jul 2024
Same period 2023 Same period 2022
Rank 98 40 127
Rank change year-on-year -58 +87 -95
Permanent jobs citing SC Cleared 188 251 134
As % of all permanent jobs advertised in Scotland 3.30% 6.62% 2.20%
As % of the Qualifications category 18.95% 19.95% 7.88%
Number of salaries quoted 39 22 51
10th Percentile £42,400 £33,000 £19,313
25th Percentile £50,625 £40,000 £23,250
Median annual salary (50th Percentile) £60,000 £50,000 £47,500
Median % change year-on-year +20.00% +5.26% +11.76%
75th Percentile £68,025 £72,575 £48,000
90th Percentile £80,180 £83,625 £62,500
UK median annual salary £57,500 £62,500 £55,500
% change year-on-year -8.00% +12.61% +0.91%

All Academic and Professional Certifications
Scotland

SC Cleared falls under the Academic Qualifications and Professional Certifications category. For comparison with the information above, the following table provides summary statistics for all permanent job vacancies requiring academic qualifications or professional certifications in Scotland.

Permanent vacancies requiring academic qualifications or professional certifications 992 1,258 1,701
As % of all permanent jobs advertised in Scotland 17.41% 33.16% 27.93%
Number of salaries quoted 467 426 550
10th Percentile £27,950 £29,000 £26,250
25th Percentile £40,000 £38,091 £32,600
Median annual salary (50th Percentile) £50,000 £50,000 £47,500
Median % change year-on-year - +5.26% +5.56%
75th Percentile £67,500 £67,500 £62,629
90th Percentile £81,550 £79,375 £80,000
UK median annual salary £55,000 £60,000 £55,000
% change year-on-year -8.33% +9.09% -

SC Cleared
Job Vacancy Trend in Scotland

Job postings citing SC Cleared as a proportion of all IT jobs advertised in Scotland.
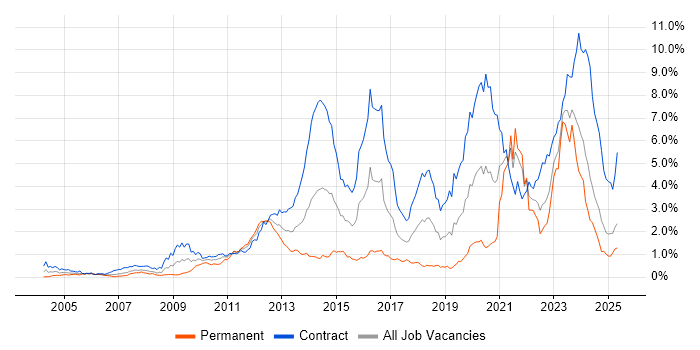
Job vacancy trend for SC Cleared in Scotland

SC Cleared
Salary Trend in Scotland

3-month moving average salary quoted in jobs citing SC Cleared in Scotland.

Salary trend for SC Cleared in Scotland

SC Cleared
Salary Histogram in Scotland

Salary distribution for jobs citing SC Cleared in Scotland over the 6 months to 26 July 2024.

Salary histogram for SC Cleared in Scotland

SC Cleared
Job Locations in Scotland

The table below looks at the demand and provides a guide to the median salaries quoted in IT jobs citing SC Cleared within the Scotland region over the 6 months to 26 July 2024. The 'Rank Change' column provides an indication of the change in demand within each location based on the same 6 month period last year.

Location Rank Change
on Same Period
Last Year
Matching
Permanent
IT Job Ads
Median Salary
Past 6 Months
Median Salary
% Change
on Same Period
Last Year
Live
Jobs
Glasgow -86 93 £60,000 -10.45% 9
Edinburgh +22 78 £58,800 -26.50% 4
Fife -3 5 £50,000 - 1
Argyll and Bute - 4 £44,000 - 5
Scottish Borders 0 2 - -
West Lothian - 2 - - 2
South Lanarkshire - 2 - - 1
Lanarkshire -13 1 - - 5
Highlands - 1 £33,500 - 1
SC Cleared
UK

SC Cleared
Co-occurring Skills and Capabilities in Scotland by Category

The follow tables expand on the table above by listing co-occurrences grouped by category. The same employment type, locality and period is covered with up to 20 co-occurrences shown in each of the following categories:

Application Platforms
1 38 (20.21%) ArcGIS
1 38 (20.21%) GeoServer
2 8 (4.26%) WebLogic
3 6 (3.19%) Confluence
4 5 (2.66%) Appian
Applications
1 8 (4.26%) Sketch
2 4 (2.13%) MS Visio
3 1 (0.53%) Microsoft Office
3 1 (0.53%) Microsoft Project
Business Applications
1 8 (4.26%) Sparx Enterprise Architect
2 6 (3.19%) Remedy ITSM
3 1 (0.53%) Primavera
Cloud Services
1 56 (29.79%) AWS
2 55 (29.26%) Azure
3 12 (6.38%) Miro
4 9 (4.79%) dbt
5 8 (4.26%) Amazon EKS
5 8 (4.26%) Amazon SQS
5 8 (4.26%) Figma
5 8 (4.26%) Heroku
6 5 (2.66%) Dynamics 365
7 4 (2.13%) Power Platform
8 3 (1.60%) GCP
9 2 (1.06%) Amazon CloudWatch
9 2 (1.06%) Amazon GuardDuty
9 2 (1.06%) AWS CloudFormation
9 2 (1.06%) AWS CloudTrail
9 2 (1.06%) AWS CodeStar
9 2 (1.06%) Azure Sentinel
9 2 (1.06%) Entra ID
9 2 (1.06%) Microsoft 365
9 2 (1.06%) OCI
Communications & Networking
1 10 (5.32%) BGP
1 10 (5.32%) DNS
2 8 (4.26%) SSL
2 8 (4.26%) TCP/IP
3 5 (2.66%) Firewall
4 3 (1.60%) Intrusion Detection
4 3 (1.60%) Software-Defined Radio
5 2 (1.06%) Cisco IOS
5 2 (1.06%) IPsec
5 2 (1.06%) LAN
5 2 (1.06%) NX-OS
5 2 (1.06%) OSPF
5 2 (1.06%) VoIP
5 2 (1.06%) VPN
5 2 (1.06%) WAN
5 2 (1.06%) Wireless
Database & Business Intelligence
1 38 (20.21%) GIS
1 38 (20.21%) PostgreSQL
1 38 (20.21%) QGIS
2 10 (5.32%) RDBMS
2 10 (5.32%) Relational Database
3 8 (4.26%) Amazon RDS
3 8 (4.26%) Oracle Database
4 2 (1.06%) MongoDB
4 2 (1.06%) MySQL
4 2 (1.06%) Power BI
5 1 (0.53%) NonStop SQL
5 1 (0.53%) Tableau
Development Applications
1 17 (9.04%) JIRA
2 2 (1.06%) Jenkins
2 2 (1.06%) SonarQube
2 2 (1.06%) Terragrunt
General
1 50 (26.60%) Social Skills
2 16 (8.51%) Inclusion and Diversity
3 12 (6.38%) Finance
4 11 (5.85%) Public Sector
5 7 (3.72%) Analytical Skills
6 3 (1.60%) Presentation Skills
7 2 (1.06%) Documentation Skills
7 2 (1.06%) Police
7 2 (1.06%) Telecoms
8 1 (0.53%) Aerospace
8 1 (0.53%) Back Office
8 1 (0.53%) Organisational Skills
8 1 (0.53%) Retail
Job Titles
1 55 (29.26%) Senior
2 40 (21.28%) Software Engineer
3 26 (13.83%) Architect
4 23 (12.23%) Lead
5 18 (9.57%) Senior Software Engineer
6 16 (8.51%) Analyst
7 15 (7.98%) Designer
8 14 (7.45%) Developer
9 13 (6.91%) Business Analyst
9 13 (6.91%) Project Manager
10 11 (5.85%) Product Manager
11 10 (5.32%) UI Designer
11 10 (5.32%) UI/UX Designer
11 10 (5.32%) UX Designer
12 9 (4.79%) Lead Architect
12 9 (4.79%) Senior Manager
13 8 (4.26%) Senior Designer
13 8 (4.26%) Senior Project Manager
13 8 (4.26%) Senior UI Designer
13 8 (4.26%) Solutions Architect
Libraries, Frameworks & Software Standards
1 41 (21.81%) React
2 40 (21.28%) .NET
3 38 (20.21%) .NET Core
3 38 (20.21%) CSS
3 38 (20.21%) Leaflet
3 38 (20.21%) OpenLayers
3 38 (20.21%) PostGIS
4 10 (5.32%) HTML
5 9 (4.79%) Node.js
6 8 (4.26%) RabbitMQ
6 8 (4.26%) Spring Boot
7 7 (3.72%) Django
8 2 (1.06%) AngularJS
8 2 (1.06%) ARM Templates
8 2 (1.06%) Hibernate
8 2 (1.06%) Spring
9 1 (0.53%) PySpark
Miscellaneous
1 8 (4.26%) Enterprise Software
1 8 (4.26%) Product Ownership
1 8 (4.26%) Public Cloud
2 6 (3.19%) Management Information System
2 6 (3.19%) Operational Technology
3 4 (2.13%) Virtual Team
4 3 (1.60%) Cyber Threat
5 2 (1.06%) Cloud Native
5 2 (1.06%) Onboarding
5 2 (1.06%) Security Operations Centre
6 1 (0.53%) SCADA
Operating Systems
1 10 (5.32%) Linux
2 8 (4.26%) Red Hat Enterprise Linux
3 4 (2.13%) Windows
4 2 (1.06%) Unix
4 2 (1.06%) Windows Server
Processes & Methodologies
1 124 (65.96%) Actionable Insight
2 104 (55.32%) Agile
3 58 (30.85%) DevOps
4 47 (25.00%) Software Engineering
5 38 (20.21%) Web Development
6 36 (19.15%) Stakeholder Management
7 30 (15.96%) Workshop Facilitation
8 28 (14.89%) User Research
9 26 (13.83%) Project Management
9 26 (13.83%) User-Centered Design (UCD)
10 22 (11.70%) Problem-Solving
11 20 (10.64%) Customer Experience
12 19 (10.11%) Prototyping
13 18 (9.57%) Digital Customer Experience
13 18 (9.57%) Scrum
14 17 (9.04%) Requirements Analysis
14 17 (9.04%) Risk Management
15 16 (8.51%) Data Migration
15 16 (8.51%) Migration
15 16 (8.51%) User Experience
Programming Languages
1 50 (26.60%) Python
2 40 (21.28%) JavaScript
3 34 (18.09%) C#
4 6 (3.19%) SQL
5 2 (1.06%) Java
5 2 (1.06%) Kusto Query Language
6 1 (0.53%) R
6 1 (0.53%) Scala
Qualifications
1 188 (100.00%) Security Cleared
2 20 (10.64%) Degree
3 10 (5.32%) AWS Certification
3 10 (5.32%) Azure Certification
4 8 (4.26%) AWS Certified Solutions Architect
4 8 (4.26%) PRINCE2 Practitioner
5 6 (3.19%) Cisco Certification
6 4 (2.13%) CCNA
6 4 (2.13%) Computer Science Degree
7 2 (1.06%) CCIE
7 2 (1.06%) DV Cleared
7 2 (1.06%) HNC
7 2 (1.06%) MCSE
7 2 (1.06%) Microsoft Certification
8 1 (0.53%) CHECK Team Leader
8 1 (0.53%) CISSP
8 1 (0.53%) ITIL Certification
8 1 (0.53%) NVQ Level 3
8 1 (0.53%) RIBA
Quality Assurance & Compliance
1 21 (11.17%) Accessibility
2 10 (5.32%) WCAG
3 6 (3.19%) COBIT
4 3 (1.60%) ISO/IEC 15288
4 3 (1.60%) PMO
4 3 (1.60%) QA
5 2 (1.06%) NIST
6 1 (0.53%) NCSC
System Software
1 2 (1.06%) Active Directory
1 2 (1.06%) Docker
Systems Management
1 6 (3.19%) OpenView
2 3 (1.60%) Kubernetes
3 2 (1.06%) Ansible
3 2 (1.06%) Terraform
4 1 (0.53%) Nessus
Vendors
1 38 (20.21%) ESRI
2 12 (6.38%) Oracle
3 11 (5.85%) Microsoft
4 9 (4.79%) ServiceNow
5 8 (4.26%) Sparx
6 6 (3.19%) BMC
6 6 (3.19%) Cisco
6 6 (3.19%) HP
6 6 (3.19%) Remedy
7 4 (2.13%) Juniper
7 4 (2.13%) Palo Alto
7 4 (2.13%) VMware
8 2 (1.06%) Black Duck
8 2 (1.06%) Cadence
8 2 (1.06%) Splunk
9 1 (0.53%) Atlassian
9 1 (0.53%) Google
9 1 (0.53%) IFS
9 1 (0.53%) NEC
9 1 (0.53%) Qualys