Risk Management Jobs in Manchester

Risk Management
North West > Manchester

The table below provides summary statistics for permanent job vacancies advertised in Manchester requiring Risk Management skills. It includes a benchmarking guide to the annual salaries offered in vacancies that cited Risk Management over the 6 months leading up to 31 May 2025, comparing them to the same period in the previous two years.

6 months to
31 May 2025
Same period 2024 Same period 2023
Rank 47 114 170
Rank change year-on-year +67 +56 -77
Permanent jobs citing Risk Management 141 112 66
As % of all permanent jobs advertised in Manchester 6.31% 2.05% 1.42%
As % of the Processes & Methodologies category 6.62% 2.42% 1.48%
Number of salaries quoted 28 86 39
10th Percentile £45,875 £42,500 £38,750
25th Percentile £58,000 £50,607 £53,083
Median annual salary (50th Percentile) £73,496 £58,982 £59,526
Median % change year-on-year +24.61% -0.91% +3.52%
75th Percentile £77,500 £75,000 £72,250
90th Percentile £85,125 £98,750 £88,000
North West median annual salary £58,500 £54,000 £55,043
% change year-on-year +8.33% -1.89% -2.79%

All Process and Methodology Skills
Manchester

Risk Management falls under the Processes and Methodologies category. For comparison with the information above, the following table provides summary statistics for all permanent job vacancies requiring process or methodology skills in Manchester.

Permanent vacancies with a requirement for process or methodology skills 2,131 4,633 4,469
As % of all permanent jobs advertised in Manchester 95.35% 84.70% 96.29%
Number of salaries quoted 1,201 3,490 2,473
10th Percentile £29,750 £30,000 £33,500
25th Percentile £40,000 £41,250 £45,000
Median annual salary (50th Percentile) £57,500 £52,500 £57,500
Median % change year-on-year +9.52% -8.70% +4.55%
75th Percentile £76,250 £68,750 £72,500
90th Percentile £92,500 £81,250 £82,500
North West median annual salary £50,055 £50,000 £55,000
% change year-on-year +0.11% -9.09% +4.76%

Risk Management
Job Vacancy Trend in Manchester

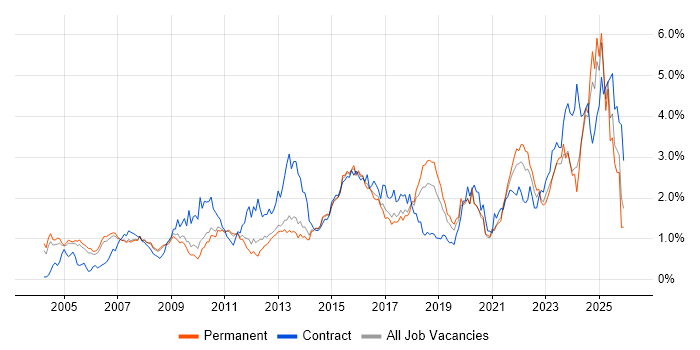
Job postings citing Risk Management as a proportion of all IT jobs advertised in Manchester.

Job vacancy trend for Risk Management in Manchester

Risk Management
Salary Trend in Manchester

3-month moving average salary quoted in jobs citing Risk Management in Manchester.

Salary trend for Risk Management in Manchester

Risk Management
Salary Histogram in Manchester

Salary distribution for jobs citing Risk Management in Manchester over the 6 months to 31 May 2025.

Salary histogram for Risk Management in Manchester

Risk Management
Job Locations in Manchester

The table below looks at the demand and provides a guide to the median salaries quoted in IT jobs citing Risk Management within the Manchester region over the 6 months to 31 May 2025. The 'Rank Change' column provides an indication of the change in demand within each location based on the same 6 month period last year.

Location Rank Change
on Same Period
Last Year
Matching
Permanent
IT Job Ads
Median Salary
Past 6 Months
Median Salary
% Change
on Same Period
Last Year
Live
Jobs
Bolton -10 9 £75,000 +7.14% 4
Cheadle - 4 £75,000 - 1
Oldham - 4 - -
Salford +15 3 £82,801 +44.00% 2
Stockport +12 3 - - 1
Sale - 3 - -
Bury - 3 - - 2
Altrincham - 2 - - 3
Ashton-under-Lyne - 2 - - 2
Dukinfield - 2 - -
Heywood - 2 - -
Wigan - 2 - -
Stalybridge - 2 - -
Rochdale - 1 - -
Littleborough - 1 - -
Risk Management
North West

Risk Management
Co-occurring Skills and Capabilities in Manchester by Category

The follow tables expand on the table above by listing co-occurrences grouped by category. The same employment type, locality and period is covered with up to 20 co-occurrences shown in each of the following categories:

Application Platforms
1 2 (1.42%) SharePoint
2 1 (0.71%) CMS
2 1 (0.71%) Microsoft Exchange
2 1 (0.71%) SAS
Applications
1 4 (2.84%) Microsoft Excel
2 3 (2.13%) Microsoft Office
2 3 (2.13%) Microsoft PowerPoint
Business Applications
1 1 (0.71%) Oracle ERP
Cloud Services
1 5 (3.55%) Azure
2 2 (1.42%) AWS
2 2 (1.42%) GCP
3 1 (0.71%) Apigee
3 1 (0.71%) Cloud Composer
3 1 (0.71%) dbt
3 1 (0.71%) IaaS
3 1 (0.71%) OCI
3 1 (0.71%) PaaS
3 1 (0.71%) Power Platform
3 1 (0.71%) SaaS
Communications & Networking
1 43 (30.50%) Cisco IOS
1 43 (30.50%) VPN
2 6 (4.26%) Firewall
2 6 (4.26%) Intrusion Detection
3 3 (2.13%) Network Security
4 1 (0.71%) Unified Communications
Database & Business Intelligence
1 5 (3.55%) Tableau
2 2 (1.42%) Data Mining
2 2 (1.42%) PostgreSQL
3 1 (0.71%) BigQuery
3 1 (0.71%) Cloud Spanner
3 1 (0.71%) MongoDB
3 1 (0.71%) MySQL
3 1 (0.71%) NoSQL
3 1 (0.71%) Power BI
Development Applications
1 2 (1.42%) GitLab
2 1 (0.71%) JIRA
General
1 71 (50.35%) Analytical Skills
2 57 (40.43%) Social Skills
3 48 (34.04%) Finance
4 46 (32.62%) Inclusion and Diversity
5 10 (7.09%) Legal
6 9 (6.38%) Financial Institution
7 7 (4.96%) Banking
8 6 (4.26%) Law
8 6 (4.26%) Marketing
9 4 (2.84%) Influencing Skills
9 4 (2.84%) Public Sector
10 3 (2.13%) Organisational Skills
11 2 (1.42%) Retail
12 1 (0.71%) Documentation Skills
12 1 (0.71%) Presentation Skills
12 1 (0.71%) Prime Brokerage
12 1 (0.71%) Retail Banking
Job Titles
1 43 (30.50%) Infrastructure Engineer
2 27 (19.15%) Risk Manager
3 13 (9.22%) Lead
4 11 (7.80%) Analyst
5 10 (7.09%) Architect
6 9 (6.38%) Security Architect
7 7 (4.96%) Credit Risk Manager
7 7 (4.96%) Project Manager
7 7 (4.96%) Senior
7 7 (4.96%) Technology Risk Manager
8 5 (3.55%) Bid Manager
8 5 (3.55%) Security Analyst
9 4 (2.84%) Assistant Project Manager
9 4 (2.84%) Bid Project Manager
9 4 (2.84%) IT Manager
9 4 (2.84%) Operations Manager
9 4 (2.84%) Security Manager
10 3 (2.13%) Change Manager
10 3 (2.13%) Service Transition Leader
11 2 (1.42%) Information Manager
Libraries, Frameworks & Software Standards
1 43 (30.50%) Elastic Stack
2 1 (0.71%) .NET
2 1 (0.71%) Kafka
Miscellaneous
1 43 (30.50%) Cyberattack
2 11 (7.80%) Self-Motivation
3 9 (6.38%) Credit Risk
3 9 (6.38%) Security Posture
4 8 (5.67%) Social Media
5 7 (4.96%) Management Information System
6 6 (4.26%) Team-Oriented Environment
7 3 (2.13%) Product Ownership
8 2 (1.42%) Algorithms
8 2 (1.42%) Blog
8 2 (1.42%) Cyber Defence
8 2 (1.42%) Cyber Kill Chain
8 2 (1.42%) Cyber Threat
8 2 (1.42%) NHS
8 2 (1.42%) Online Banking
9 1 (0.71%) Blockchain
9 1 (0.71%) Driving Licence
9 1 (0.71%) Hedge funds
9 1 (0.71%) Mobile App
9 1 (0.71%) Public Cloud
Operating Systems
1 50 (35.46%) Windows
2 43 (30.50%) Android
2 43 (30.50%) Linux
3 6 (4.26%) Windows Vista
Processes & Methodologies
1 64 (45.39%) Problem-Solving
2 56 (39.72%) Line Management
3 47 (33.33%) DevOps
4 45 (31.91%) Mathematics
5 43 (30.50%) Infrastructure Engineering
5 43 (30.50%) Platform Engineering
5 43 (30.50%) Storage Management
5 43 (30.50%) Task Automation
6 39 (27.66%) Continuous Improvement
7 33 (23.40%) Decision-Making
8 32 (22.70%) Stakeholder Management
9 28 (19.86%) Coaching
10 25 (17.73%) Information Security
11 20 (14.18%) Cybersecurity
12 19 (13.48%) Agile
13 17 (12.06%) Creative Thinking
14 15 (10.64%) Vulnerability Management
15 14 (9.93%) Risk Assessment
16 12 (8.51%) Strategic Thinking
17 11 (7.80%) Collaborative Working
Programming Languages
1 45 (31.91%) Python
2 44 (31.21%) Bash
3 43 (30.50%) PowerShell
4 3 (2.13%) SQL
5 1 (0.71%) C#
Qualifications
1 18 (12.77%) Degree
2 17 (12.06%) CRISC
3 14 (9.93%) CISSP
4 12 (8.51%) CISA
5 10 (7.09%) (ISC)2 CCSP
5 10 (7.09%) Cisco Certification
6 9 (6.38%) CISM
7 8 (5.67%) Computer Science Degree
8 6 (4.26%) CEH
8 6 (4.26%) DBS Check
8 6 (4.26%) Master's Degree
9 4 (2.84%) CompTIA Security+
9 4 (2.84%) ISO 27001 Lead Auditor
9 4 (2.84%) SC Cleared
9 4 (2.84%) Security Cleared
10 3 (2.13%) ACCA
10 3 (2.13%) CCAB
10 3 (2.13%) CIMA
10 3 (2.13%) CIPFA
10 3 (2.13%) ICAEW
Quality Assurance & Compliance
1 18 (12.77%) ISO/IEC 27001
2 16 (11.35%) NIST
3 15 (10.64%) COBIT
4 12 (8.51%) Sarbanes-Oxley
5 11 (7.80%) GDPR
6 10 (7.09%) ITGC
7 3 (2.13%) Data Quality
7 3 (2.13%) GRC
7 3 (2.13%) NCSC
8 2 (1.42%) PCI DSS
8 2 (1.42%) QA
9 1 (0.71%) California Consumer Privacy Act
9 1 (0.71%) P3O
9 1 (0.71%) PERC
System Software
1 44 (31.21%) Docker
2 43 (30.50%) Hyper-V
2 43 (30.50%) VMware NSX
2 43 (30.50%) vSphere
Systems Management
1 44 (31.21%) Terraform
2 43 (30.50%) Ansible
3 2 (1.42%) Kubernetes
4 1 (0.71%) Istio
Vendors
1 44 (31.21%) Cisco
2 43 (30.50%) 3PAR
2 43 (30.50%) Juniper
2 43 (30.50%) Splunk
3 7 (4.96%) Avaloq
3 7 (4.96%) Microsoft
4 2 (1.42%) Facebook
5 1 (0.71%) Bloomberg
5 1 (0.71%) Confluent
5 1 (0.71%) Oracle
5 1 (0.71%) Rapid7