Analytical Skills Job Trends in Manchester

Analytical Skills
North West > Manchester

The table below looks at the prevalence of the term Analytical Skills in permanent job vacancies in Manchester. Included is a benchmarking guide to the salaries offered in vacancies that cited Analytical Skills over the 6 months leading up to 13 November 2025, comparing them to the same period in the previous two years.

6 months to
13 Nov 2025
Same period 2024 Same period 2023
Rank 13 16 30
Rank change year-on-year +3 +14 +9
Permanent jobs citing Analytical Skills 254 355 187
As % of all permanent jobs in Manchester 10.46% 9.81% 7.91%
As % of the General category 16.66% 16.51% 12.98%
Number of salaries quoted 112 136 149
10th Percentile £32,500 £32,500 £37,250
25th Percentile £33,219 £40,000 £42,750
Median annual salary (50th Percentile) £42,500 £50,000 £58,500
Median % change year-on-year -15.00% -14.53% +30.00%
75th Percentile £55,000 £63,188 £67,070
90th Percentile £69,750 £77,500 £72,500
North West median annual salary £45,000 £52,500 £50,000
% change year-on-year -14.29% +5.00% +11.11%

All General Skills
Manchester

Analytical Skills falls under the General Skills category. For comparison with the information above, the following table provides summary statistics for all permanent job vacancies requiring common skills in Manchester.

Permanent vacancies with a requirement for common skills 1,525 2,150 1,441
As % of all permanent jobs advertised in Manchester 62.81% 59.44% 60.96%
Number of salaries quoted 880 827 1,120
10th Percentile £27,000 £30,950 £32,092
25th Percentile £32,500 £41,250 £43,000
Median annual salary (50th Percentile) £47,500 £52,500 £59,526
Median % change year-on-year -9.52% -11.80% +8.23%
75th Percentile £67,500 £68,750 £72,500
90th Percentile £82,625 £86,250 £85,000
North West median annual salary £46,500 £50,000 £55,000
% change year-on-year -7.00% -9.09% +4.76%

Analytical Skills
Job Vacancy Trend in Manchester

Historical trend showing the proportion of permanent IT job postings citing Analytical Skills relative to all permanent IT jobs advertised in Manchester.
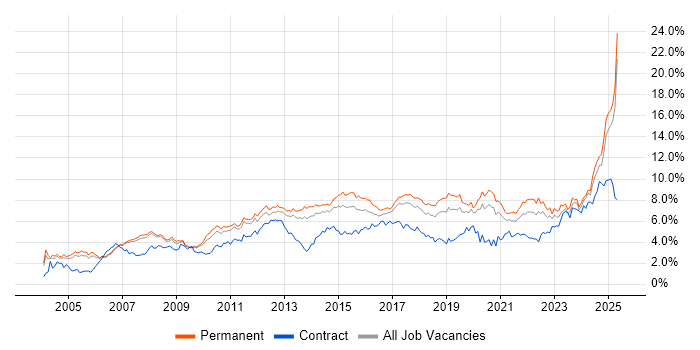
Analytical Skills job vacancy trend in Manchester

Analytical Skills
Salary Trend in Manchester

Salary distribution trend for jobs in Manchester citing Analytical Skills.

Salary distribution trend for jobs in Manchester citing Analytical Skills

Analytical Skills
Salary Histogram in Manchester

Salary distribution for jobs citing Analytical Skills in Manchester over the 6 months to 13 November 2025.

Salary histogram for Analytical Skills in Manchester

Analytical Skills
Job Locations in Manchester

The table below looks at the demand and provides a guide to the median salaries quoted in IT jobs citing Analytical Skills within the Manchester region over the 6 months to 13 November 2025. The 'Rank Change' column provides an indication of the change in demand within each location based on the same 6 month period last year.

Location Rank Change
on Same Period
Last Year
Matching
Permanent
IT Job Ads
Median Salary
Past 6 Months
Median Salary
% Change
on Same Period
Last Year
Live
Jobs
Salford +6 19 £39,750 -33.11% 12
Stockport +7 10 £57,875 +21.84% 11
Bury +1 4 - - 9
Bolton -6 3 £45,000 +5.88% 15
Oldham +8 2 £56,504 -16.29% 6
Cheadle -5 1 £200,000 - 2
Altrincham - 1 £50,000 - 9
Analytical Skills
North West

Analytical Skills
Co-Occurring Skills & Capabilities in Manchester by Category

The following tables expand on the one above by listing co-occurrences grouped by category. They cover the same employment type, locality and period, with up to 20 co-occurrences shown in each category:

Application Platforms
1 17 (6.69%) SharePoint
2 16 (6.30%) Microsoft Exchange
3 9 (3.54%) Confluence
4 2 (0.79%) CMS
4 2 (0.79%) nginx
5 1 (0.39%) Apache
5 1 (0.39%) Apache Spark
5 1 (0.39%) FactoryTalk
5 1 (0.39%) SAS
5 1 (0.39%) WinCC
Applications
1 58 (22.83%) Chatbot
2 48 (18.90%) Microsoft Excel
3 26 (10.24%) Microsoft Office
4 10 (3.94%) Microsoft PowerPoint
5 2 (0.79%) AutoCAD
5 2 (0.79%) Microsoft Project
5 2 (0.79%) Revit
6 1 (0.39%) Siemens NX
6 1 (0.39%) Spreadsheet
Business Applications
1 6 (2.36%) NetSuite
2 2 (0.79%) Oracle Assets
2 2 (0.79%) Oracle General Ledger
2 2 (0.79%) Oracle Payables
2 2 (0.79%) Oracle Receivables
3 1 (0.39%) Salesforce CRM
3 1 (0.39%) SAP CO
3 1 (0.39%) SAP ERP
3 1 (0.39%) SAP FI
3 1 (0.39%) SAP FI/CO
3 1 (0.39%) SAP S/4HANA
3 1 (0.39%) Siebel CRM
3 1 (0.39%) Teamcenter
Cloud Services
1 34 (13.39%) Azure
2 32 (12.60%) Power Platform
3 27 (10.63%) Microsoft 365
4 24 (9.45%) AWS
5 21 (8.27%) Entra ID
6 11 (4.33%) Microsoft Purview
7 10 (3.94%) Microsoft Copilot
7 10 (3.94%) SaaS
8 7 (2.76%) GCP
9 6 (2.36%) Adobe Analytics
9 6 (2.36%) Figma
10 3 (1.18%) Google Sheets
10 3 (1.18%) Google Workspace
11 2 (0.79%) Azure Data Factory
11 2 (0.79%) Azure Synapse Analytics
11 2 (0.79%) GitHub
11 2 (0.79%) Google Analytics
11 2 (0.79%) Google Docs
11 2 (0.79%) iPaaS
11 2 (0.79%) OCI
Communications & Networking
1 17 (6.69%) Firewall
2 6 (2.36%) DHCP
2 6 (2.36%) DNS
2 6 (2.36%) VLAN
3 3 (1.18%) Network Security
4 1 (0.39%) Ethernet
4 1 (0.39%) Intrusion Detection
4 1 (0.39%) LAN
4 1 (0.39%) SMS
4 1 (0.39%) TCP/IP
4 1 (0.39%) VPN
4 1 (0.39%) WAN
4 1 (0.39%) Wireless
Database & Business Intelligence
1 31 (12.20%) Power BI
2 14 (5.51%) Tableau
3 11 (4.33%) Data Mining
4 8 (3.15%) SQL Server
5 6 (2.36%) Relational Database
6 5 (1.97%) BusinessObjects
6 5 (1.97%) Data Lake
6 5 (1.97%) Looker
7 4 (1.57%) Data Warehouse
7 4 (1.57%) MySQL
8 3 (1.18%) PostgreSQL
9 2 (0.79%) Azure SQL Database
9 2 (0.79%) MongoDB
9 2 (0.79%) NoSQL
9 2 (0.79%) SQL Server Reporting Services
10 1 (0.39%) Amazon Redshift
10 1 (0.39%) Big Data
10 1 (0.39%) Elasticsearch
10 1 (0.39%) Power Query
10 1 (0.39%) Qlik Sense
Development Applications
1 9 (3.54%) JIRA
2 7 (2.76%) Git
3 3 (1.18%) WaveMaker
4 2 (0.79%) Cucumber
4 2 (0.79%) GitLab
4 2 (0.79%) Selenium
5 1 (0.39%) Cypress.io
5 1 (0.39%) Gatling
5 1 (0.39%) JMeter
5 1 (0.39%) LoadRunner
General
1 120 (47.24%) Social Skills
2 94 (37.01%) Finance
3 16 (6.30%) Retail
4 14 (5.51%) Banking
4 14 (5.51%) Influencing Skills
4 14 (5.51%) Marketing
5 12 (4.72%) Legal
5 12 (4.72%) Public Sector
6 11 (4.33%) Inclusion and Diversity
7 10 (3.94%) Law
8 9 (3.54%) Local Government
9 8 (3.15%) Manufacturing
9 8 (3.15%) Presentation Skills
10 6 (2.36%) Organisational Skills
10 6 (2.36%) Telecoms
11 5 (1.97%) Police
12 3 (1.18%) Advertising
12 3 (1.18%) Electronics
12 3 (1.18%) General Ledger
13 2 (0.79%) Military
Job Titles
1 69 (27.17%) Analyst
2 58 (22.83%) Trainer
3 19 (7.48%) Support Engineer
4 17 (6.69%) Financial Analyst
5 16 (6.30%) Data Analyst
6 15 (5.91%) Senior
7 13 (5.12%) Commercial Analyst
8 12 (4.72%) Architect
9 11 (4.33%) Lead
9 11 (4.33%) Solutions Architect
10 10 (3.94%) Applications Support
10 10 (3.94%) Microsoft 365 Engineer
10 10 (3.94%) Microsoft Engineer
11 9 (3.54%) Developer
11 9 (3.54%) Technical Engineer
11 9 (3.54%) Technical Support
11 9 (3.54%) Technical Support Engineer
12 8 (3.15%) Azure Architect
13 7 (2.76%) AWS Architect
13 7 (2.76%) TOGAF Architect
Libraries, Frameworks & Software Standards
1 6 (2.36%) Software Packaging
1 6 (2.36%) Spring
1 6 (2.36%) Spring Boot
2 4 (1.57%) RESTful
2 4 (1.57%) Web Services
3 2 (0.79%) CSS
3 2 (0.79%) HTML
3 2 (0.79%) jQuery
3 2 (0.79%) Kafka
3 2 (0.79%) Laravel
3 2 (0.79%) Oracle Fusion
3 2 (0.79%) PySpark
3 2 (0.79%) React
3 2 (0.79%) REST
4 1 (0.39%) React Native
Miscellaneous
1 41 (16.14%) Analytical Mindset
2 21 (8.27%) Self-Motivation
3 14 (5.51%) Driving Licence
4 11 (4.33%) Onboarding
4 11 (4.33%) Social Media
5 10 (3.94%) Management Information System
6 9 (3.54%) Cloud Native
7 7 (2.76%) Data Protection Act
8 5 (1.97%) Data Structures
8 5 (1.97%) EPoS
8 5 (1.97%) NHS
9 3 (1.18%) Derivative
9 3 (1.18%) Equities
9 3 (1.18%) Foreign Exchange (FX)
9 3 (1.18%) Virtual Team
10 2 (0.79%) Algorithms
10 2 (0.79%) Enterprise Software
10 2 (0.79%) Fixed Income
10 2 (0.79%) SCADA
10 2 (0.79%) Wiki
Operating Systems
1 11 (4.33%) Windows
2 5 (1.97%) Windows Server
2 5 (1.97%) Windows Server 2012
2 5 (1.97%) Windows Server 2019
Processes & Methodologies
1 96 (37.80%) Problem-Solving
2 87 (34.25%) AI
3 62 (24.41%) Decision-Making
4 58 (22.83%) Chemistry
4 58 (22.83%) Conversational UI
5 46 (18.11%) Agile
6 38 (14.96%) Continuous Improvement
7 30 (11.81%) Business Intelligence
8 29 (11.42%) Analytics
9 28 (11.02%) Actionable Insight
9 28 (11.02%) Data Analysis
10 27 (10.63%) ERP
11 23 (9.06%) Stakeholder Management
12 21 (8.27%) Budgeting and Forecasting
13 20 (7.87%) Business Analysis
13 20 (7.87%) Business Strategy
14 18 (7.09%) Project Management
14 18 (7.09%) Visualisation
15 17 (6.69%) Data Management
16 16 (6.30%) Change Management
Programming Languages
1 52 (20.47%) SQL
2 13 (5.12%) Python
3 12 (4.72%) PowerShell
4 8 (3.15%) Java
5 7 (2.76%) VBA
6 2 (0.79%) Data Analysis Expressions
6 2 (0.79%) JavaScript
6 2 (0.79%) PHP
7 1 (0.39%) R
7 1 (0.39%) Scala
Qualifications
1 108 (42.52%) Degree
2 62 (24.41%) Master's Degree
3 58 (22.83%) PhD
4 13 (5.12%) DBS Check
5 11 (4.33%) ACCA
5 11 (4.33%) CIMA
6 7 (2.76%) Computer Science Degree
6 7 (2.76%) TOGAF Certification
7 3 (1.18%) AAT
8 2 (0.79%) Azure Certification
8 2 (0.79%) Chartered Engineer
8 2 (0.79%) DV Cleared
8 2 (0.79%) Security Cleared
9 1 (0.39%) CISA
9 1 (0.39%) Cisco Certification
9 1 (0.39%) CISSP
9 1 (0.39%) JNCIA
9 1 (0.39%) MBA
9 1 (0.39%) Microsoft Certification
9 1 (0.39%) Network+ Certification
Quality Assurance & Compliance
1 11 (4.33%) ISO/IEC 27001
2 9 (3.54%) QA
3 8 (3.15%) GDPR
4 7 (2.76%) Accessibility
5 6 (2.36%) California Consumer Privacy Act
6 5 (1.97%) GLBA
7 3 (1.18%) Data Quality
8 2 (0.79%) FINRA
8 2 (0.79%) P3O
9 1 (0.39%) Actionable Recommendations
9 1 (0.39%) COBIT
9 1 (0.39%) ITGC
9 1 (0.39%) NIST
9 1 (0.39%) Sarbanes-Oxley
System Software
1 17 (6.69%) Active Directory
2 9 (3.54%) Hyper-V
3 6 (2.36%) VMware Infrastructure
4 5 (1.97%) Docker
5 1 (0.39%) VMware ESXi
Systems Management
1 10 (3.94%) Microsoft Intune
2 3 (1.18%) Kubernetes
3 1 (0.39%) AssetCenter
3 1 (0.39%) SCCM
3 1 (0.39%) Single Sign-On
3 1 (0.39%) Terraform
Vendors
1 65 (25.59%) Microsoft
2 58 (22.83%) PayPal
3 13 (5.12%) Google
4 12 (4.72%) SAP
5 7 (2.76%) VMware
6 6 (2.36%) Adobe
6 6 (2.36%) Qualtrics
7 5 (1.97%) Bloomberg
7 5 (1.97%) Facebook
7 5 (1.97%) Guidewire
7 5 (1.97%) iManage
7 5 (1.97%) MobileIron
7 5 (1.97%) Oracle
7 5 (1.97%) Splunk
7 5 (1.97%) Veeam
8 4 (1.57%) AppDynamics
8 4 (1.57%) IBM
8 4 (1.57%) Moogsoft
8 4 (1.57%) Salesforce
9 3 (1.18%) Cisco