Senior Jobs in Manchester

Senior
North West > Manchester

The median Senior salary in Manchester is £65,000 per year, according to job vacancies posted during the 6 months leading to 30 May 2025.

The table below provides salary benchmarking and summary statistics, comparing them to the same period in the previous two years.

6 months to
30 May 2025
Same period 2024 Same period 2023
Rank 9 5 14
Rank change year-on-year -4 +9 -3
Permanent jobs requiring a Senior 366 936 661
As % of all permanent jobs advertised in Manchester 16.55% 17.20% 14.11%
As % of the Job Titles category 18.16% 18.16% 15.32%
Number of salaries quoted 212 657 421
10th Percentile £46,375 £42,000 £45,750
25th Percentile £53,750 £52,500 £52,500
Median annual salary (50th Percentile) £65,000 £60,000 £65,000
Median % change year-on-year +8.33% -7.69% +12.75%
75th Percentile £75,000 £70,000 £75,000
90th Percentile £96,525 £80,000 £86,250
North West median annual salary £50,055 £60,000 £60,000
% change year-on-year -16.58% - +4.35%

All Permanent IT Job Vacancies
Manchester

For comparison with the information above, the following table provides summary statistics for all permanent IT job vacancies in Manchester. Most job vacancies include a discernible job title that can be normalized. As such, the figures in the second row provide an indication of the number of permanent jobs in our overall sample.

Permanent vacancies in Manchester with a recognized job title 2,015 5,153 4,315
% of permanent jobs with a recognized job title 91.09% 94.67% 92.08%
Number of salaries quoted 1,166 3,945 2,578
10th Percentile £31,250 £30,000 £32,500
25th Percentile £41,250 £40,988 £42,874
Median annual salary (50th Percentile) £57,750 £52,500 £57,500
Median % change year-on-year +10.00% -8.70% +4.55%
75th Percentile £76,840 £68,750 £71,250
90th Percentile £93,764 £80,000 £82,500
North West median annual salary £50,055 £50,000 £55,000
% change year-on-year +0.11% -9.09% +4.76%

Senior
Job Vacancy Trend in Manchester

Job postings that featured Senior in the job title as a proportion of all IT jobs advertised in Manchester.
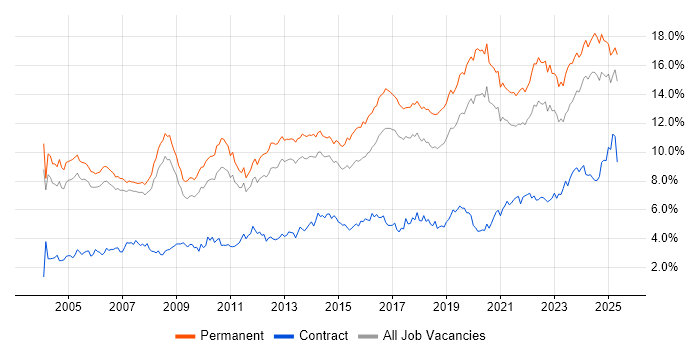
Job vacancy trend for Senior in Manchester

Senior
Salary Trend in Manchester

3-month moving average salary quoted in jobs citing Senior in Manchester.

Salary trend for Senior in Manchester

Senior
Salary Histogram in Manchester

Salary distribution for jobs citing Senior in Manchester over the 6 months to 30 May 2025.

Salary histogram for Senior in Manchester

Senior
Job Locations in Manchester

The table below looks at the demand and provides a guide to the median salaries quoted in IT jobs citing Senior within the Manchester region over the 6 months to 30 May 2025. The 'Rank Change' column provides an indication of the change in demand within each location based on the same 6 month period last year.

Location Rank Change
on Same Period
Last Year
Matching
Permanent
IT Job Ads
Median Salary
Past 6 Months
Median Salary
% Change
on Same Period
Last Year
Live
Jobs
Altrincham +2 11 £65,000 -3.70% 25
Stockport -2 10 £34,000 -32.00% 243
Oldham - 7 - - 1
Cheadle +7 6 - -
Salford -7 6 £72,192 +60.43% 5
Heywood - 6 - -
Bury +7 5 - - 20
Sale - 5 - -
Dukinfield - 5 - -
Ashton-under-Lyne - 5 - - 27
Stalybridge - 5 - -
Bolton -21 1 - - 334
Senior
North West

Senior Skill Set
Top 30 Co-occurring Skills and Capabilities in Manchester

For the 6 months to 30 May 2025, Senior job roles required the following skills and capabilities in order of popularity. The figures indicate the absolute number co-occurrences and as a proportion of all permanent job ads across the Manchester region featuring Senior in the job title.

1 178 (48.63%) Agile
2 170 (46.45%) AWS
3 149 (40.71%) Software Engineering
3 149 (40.71%) Python
4 148 (40.44%) Azure
5 138 (37.70%) JavaScript
6 135 (36.89%) Java
7 124 (33.88%) Mentoring
8 114 (31.15%) Microservices
8 114 (31.15%) GCP
9 113 (30.87%) Node.js
10 112 (30.60%) .NET
11 111 (30.33%) User Experience
12 101 (27.60%) Linux
12 101 (27.60%) Scrum
13 99 (27.05%) Machine Learning
14 97 (26.50%) Security Cleared
15 96 (26.23%) Cloud Security
16 91 (24.86%) Go
17 90 (24.59%) AWS Certification
18 89 (24.32%) Data Engineering
18 89 (24.32%) C++
18 89 (24.32%) AWS Certified Solutions Architect
19 85 (23.22%) Inclusion and Diversity
20 84 (22.95%) Cyberattack
21 83 (22.68%) Self-Motivation
21 83 (22.68%) Site Reliability Engineering
22 82 (22.40%) Linux Command Line
22 82 (22.40%) AWS Certified Developer
22 82 (22.40%) Rust

Senior Skill Set
Co-occurring Skills and Capabilities in Manchester by Category

The follow tables expand on the table above by listing co-occurrences grouped by category. The same employment type, locality and period is covered with up to 20 co-occurrences shown in each of the following categories:

Application Platforms
1 10 (2.73%) Confluence
2 5 (1.37%) Apache Spark
3 4 (1.09%) Apache
3 4 (1.09%) Microsoft Exchange
3 4 (1.09%) SAS
4 3 (0.82%) IIS
5 2 (0.55%) CMS
5 2 (0.55%) Headless CMS
5 2 (0.55%) nginx
6 1 (0.27%) SharePoint
Applications
1 5 (1.37%) AutoCAD
1 5 (1.37%) Microsoft Excel
2 2 (0.55%) Adobe XD
3 1 (0.27%) Adobe Creative Suite
3 1 (0.27%) Adobe Illustrator
3 1 (0.27%) InDesign
3 1 (0.27%) Microsoft Office
3 1 (0.27%) Microsoft PowerPoint
3 1 (0.27%) Photoshop
3 1 (0.27%) Sketch
Business Applications
1 4 (1.09%) Dynamics CRM
2 2 (0.55%) SAP S/4HANA
3 1 (0.27%) Magento
3 1 (0.27%) SAP IBP
Cloud Services
1 170 (46.45%) AWS
2 148 (40.44%) Azure
3 114 (31.15%) GCP
4 22 (6.01%) Power Platform
5 17 (4.64%) Serverless
6 15 (4.10%) AWS Lambda
6 15 (4.10%) Cloud Computing
7 14 (3.83%) SaaS
8 10 (2.73%) Azure Machine Learning
9 9 (2.46%) Azure DevOps
10 8 (2.19%) Dynamics 365
11 6 (1.64%) AWS CloudFormation
11 6 (1.64%) Microsoft 365
11 6 (1.64%) Microsoft Copilot
12 4 (1.09%) Amazon ECS
12 4 (1.09%) GitHub
12 4 (1.09%) Google Analytics
13 3 (0.82%) AWS CodeBuild
13 3 (0.82%) Power Automate
13 3 (0.82%) Pulumi
Communications & Networking
1 8 (2.19%) Wireless
2 4 (1.09%) DNS
3 3 (0.82%) DHCP
3 3 (0.82%) HTTP
3 3 (0.82%) Internet
3 3 (0.82%) TCP/IP
4 2 (0.55%) Cisco Nexus
4 2 (0.55%) Firewall
4 2 (0.55%) LAN
4 2 (0.55%) LoRaWAN
4 2 (0.55%) NAS
4 2 (0.55%) SAN
4 2 (0.55%) TETRA
5 1 (0.27%) Bluetooth
5 1 (0.27%) Reverse Proxy
5 1 (0.27%) Unified Communications
Database & Business Intelligence
1 19 (5.19%) SQL Server
2 16 (4.37%) MySQL
2 16 (4.37%) Power BI
3 15 (4.10%) NoSQL
4 11 (3.01%) MongoDB
4 11 (3.01%) PostgreSQL
5 10 (2.73%) Cloud Spanner
5 10 (2.73%) DynamoDB
6 7 (1.91%) Elasticsearch
7 6 (1.64%) Data Warehouse
8 5 (1.37%) Big Data
8 5 (1.37%) GIS
8 5 (1.37%) SQL Server Analysis Services
9 4 (1.09%) Power Query
9 4 (1.09%) PowerPivot
10 3 (0.82%) Data Hub
10 3 (0.82%) Metadata
10 3 (0.82%) Oracle BI Publisher
10 3 (0.82%) Redis
10 3 (0.82%) SQL CLR
Development Applications
1 29 (7.92%) Git
2 14 (3.83%) JIRA
3 11 (3.01%) Jenkins
4 5 (1.37%) JUnit
5 4 (1.09%) Storybook
6 3 (0.82%) Bitbucket
6 3 (0.82%) Maven
6 3 (0.82%) NUnit
6 3 (0.82%) Octopus Deploy
6 3 (0.82%) SonarQube
6 3 (0.82%) Sonatype Nexus
7 2 (0.55%) TestRail
8 1 (0.27%) Cucumber
8 1 (0.27%) fastlane
8 1 (0.27%) PHPUnit
8 1 (0.27%) Selenium
General
1 85 (23.22%) Inclusion and Diversity
2 79 (21.58%) Finance
3 63 (17.21%) Social Skills
4 36 (9.84%) Analytical Skills
5 33 (9.02%) Retail
6 29 (7.92%) Banking
7 21 (5.74%) Games
8 14 (3.83%) Law
9 10 (2.73%) Back Office
10 9 (2.46%) Marketing
10 9 (2.46%) Telecoms
11 8 (2.19%) Public Sector
12 7 (1.91%) Electronics
12 7 (1.91%) Tech for Good
13 6 (1.64%) Aerospace
13 6 (1.64%) Legal
13 6 (1.64%) Manufacturing
14 5 (1.37%) Local Government
15 4 (1.09%) Billing
15 4 (1.09%) Wholesale Banking
Libraries, Frameworks & Software Standards
1 113 (30.87%) Node.js
2 112 (30.60%) .NET
3 66 (18.03%) React
4 26 (7.10%) RESTful
5 20 (5.46%) CSS
5 20 (5.46%) HTML
6 18 (4.92%) AngularJS
7 17 (4.64%) .NET Core
7 17 (4.64%) REST
7 17 (4.64%) Spring Boot
8 14 (3.83%) Web Services
9 10 (2.73%) Vue
10 9 (2.46%) ASP.NET Web API
10 9 (2.46%) Kafka
10 9 (2.46%) Spring
11 8 (2.19%) Redux
12 7 (1.91%) ARM Templates
12 7 (1.91%) GraphQL
12 7 (1.91%) Next.js
13 6 (1.64%) Blazor
Miscellaneous
1 84 (22.95%) Cyberattack
2 83 (22.68%) Self-Motivation
3 82 (22.40%) Linux Command Line
4 18 (4.92%) Product Ownership
5 16 (4.37%) Cloud Native
6 10 (2.73%) Algorithms
6 10 (2.73%) Greenfield Project
6 10 (2.73%) Public Cloud
7 8 (2.19%) Hybrid Cloud
7 8 (2.19%) Mobile App
7 8 (2.19%) Onboarding
8 7 (1.91%) Distributed Systems
8 7 (1.91%) Management Information System
9 6 (1.64%) Device Driver
10 5 (1.37%) e-Learning
10 5 (1.37%) IoT
10 5 (1.37%) Legacy Systems
11 4 (1.09%) Analytical Mindset
11 4 (1.09%) Renewable Energy
11 4 (1.09%) Social Media
Operating Systems
1 101 (27.60%) Linux
2 7 (1.91%) Unix
3 6 (1.64%) Windows
3 6 (1.64%) Windows Server
4 3 (0.82%) CentOS
4 3 (0.82%) Mac OS X
4 3 (0.82%) Windows 10
4 3 (0.82%) Windows Server 2016
5 2 (0.55%) Android
5 2 (0.55%) Apple iOS
Processes & Methodologies
1 178 (48.63%) Agile
2 149 (40.71%) Software Engineering
3 124 (33.88%) Mentoring
4 114 (31.15%) Microservices
5 111 (30.33%) User Experience
6 101 (27.60%) Scrum
7 99 (27.05%) Machine Learning
8 96 (26.23%) Cloud Security
9 89 (24.32%) Data Engineering
10 83 (22.68%) Site Reliability Engineering
11 50 (13.66%) CI/CD
12 49 (13.39%) Problem-Solving
13 43 (11.75%) Analytics
14 40 (10.93%) DevOps
15 33 (9.02%) Coaching
16 31 (8.47%) Test Automation
17 29 (7.92%) TDD
18 23 (6.28%) Infrastructure Engineering
19 20 (5.46%) Continuous Integration
20 19 (5.19%) Artificial Intelligence
Programming Languages
1 149 (40.71%) Python
2 138 (37.70%) JavaScript
3 135 (36.89%) Java
4 91 (24.86%) Go
5 89 (24.32%) C++
6 82 (22.40%) Rust
7 64 (17.49%) TypeScript
8 47 (12.84%) SQL
9 32 (8.74%) C#
10 14 (3.83%) PHP
11 6 (1.64%) C
12 5 (1.37%) Scala
12 5 (1.37%) T-SQL
13 4 (1.09%) VB
14 3 (0.82%) Data Analysis Expressions
15 2 (0.55%) Apex Code
16 1 (0.27%) Kotlin
16 1 (0.27%) R
Qualifications
1 97 (26.50%) Security Cleared
2 90 (24.59%) AWS Certification
3 89 (24.32%) AWS Certified Solutions Architect
4 82 (22.40%) AWS Certified Developer
4 82 (22.40%) DV Cleared
5 45 (12.30%) Degree
6 15 (4.10%) Azure Certification
7 9 (2.46%) Computer Science Degree
8 7 (1.91%) ACCA
8 7 (1.91%) SC Cleared
9 5 (1.37%) Microsoft Certification
10 4 (1.09%) MRICS
11 3 (0.82%) ACSP
11 3 (0.82%) CCAB
11 3 (0.82%) CIMA
11 3 (0.82%) CIPFA
11 3 (0.82%) HP AIS
11 3 (0.82%) ICAEW
11 3 (0.82%) Master's Degree
11 3 (0.82%) Network+ Certification
Quality Assurance & Compliance
1 7 (1.91%) Accessibility
1 7 (1.91%) Data Quality
1 7 (1.91%) GDPR
2 6 (1.64%) HIPAA
2 6 (1.64%) NIST
3 5 (1.37%) QA
4 4 (1.09%) GAAP
4 4 (1.09%) IFRS
4 4 (1.09%) ISO/IEC 27001
4 4 (1.09%) SLA
5 2 (0.55%) Sarbanes-Oxley
6 1 (0.27%) Cyber Essentials
6 1 (0.27%) IEC 62304
6 1 (0.27%) ISO 13485
6 1 (0.27%) WCAG
System Software
1 41 (11.20%) Docker
2 9 (2.46%) Active Directory
3 3 (0.82%) VMware Infrastructure
3 3 (0.82%) vSphere
4 2 (0.55%) VMware ESXi
4 2 (0.55%) VMware NSX
Systems Management
1 42 (11.48%) Kubernetes
2 23 (6.28%) Terraform
3 7 (1.91%) Ansible
4 5 (1.37%) SCCM
5 3 (0.82%) AWS Copilot
5 3 (0.82%) Failover Clustering
5 3 (0.82%) Istio
6 2 (0.55%) Microsoft Intune
Vendors
1 40 (10.93%) Microsoft
2 26 (7.10%) Google
3 12 (3.28%) Bloomberg
4 10 (2.73%) Ping Identity
5 9 (2.46%) VMware
6 6 (1.64%) IBM
7 5 (1.37%) Cisco
7 5 (1.37%) Databricks
7 5 (1.37%) Oracle
8 3 (0.82%) Apple
8 3 (0.82%) Concur
8 3 (0.82%) HP
8 3 (0.82%) Informatica
8 3 (0.82%) Instagram
8 3 (0.82%) New Relic
8 3 (0.82%) Salesforce
8 3 (0.82%) Twitter
8 3 (0.82%) Veeam
9 2 (0.55%) ESET
9 2 (0.55%) Moogsoft