Migration Jobs in Nottingham

Migration
Nottinghamshire > Nottingham

The table below provides summary statistics for permanent job vacancies advertised in Nottingham requiring Migration skills. It includes a benchmarking guide to the annual salaries offered in vacancies that cited Migration over the 6 months leading up to 11 August 2025, comparing them to the same period in the previous two years.

6 months to
11 Aug 2025
Same period 2024 Same period 2023
Rank 36 50 42
Rank change year-on-year +14 -8 +25
Permanent jobs citing Migration 13 19 12
As % of all permanent jobs advertised in Nottingham 2.91% 2.27% 2.71%
As % of the Processes & Methodologies category 3.43% 2.95% 2.91%
Number of salaries quoted 11 5 12
10th Percentile - £46,300 £43,750
25th Percentile £28,000 £47,500 £47,500
Median annual salary (50th Percentile) £42,500 £65,000 £67,500
Median % change year-on-year -34.62% -3.70% +20.54%
75th Percentile £45,625 £78,750 £71,250
90th Percentile £48,750 £91,500 -
Nottinghamshire median annual salary £38,500 £65,000 £67,500
% change year-on-year -40.77% -3.70% +22.73%

All Process and Methodology Skills
Nottingham

Migration falls under the Processes and Methodologies category. For comparison with the information above, the following table provides summary statistics for all permanent job vacancies requiring process or methodology skills in Nottingham.

Permanent vacancies with a requirement for process or methodology skills 379 643 412
As % of all permanent jobs advertised in Nottingham 84.79% 76.91% 93.21%
Number of salaries quoted 244 393 285
10th Percentile £27,000 £32,500 £31,125
25th Percentile £28,750 £41,250 £43,750
Median annual salary (50th Percentile) £47,500 £50,000 £57,500
Median % change year-on-year -5.00% -13.04% +15.00%
75th Percentile £60,313 £67,500 £75,000
90th Percentile £80,000 £75,000 £85,000
Nottinghamshire median annual salary £40,000 £50,000 £56,250
% change year-on-year -20.00% -11.11% +12.50%

Migration
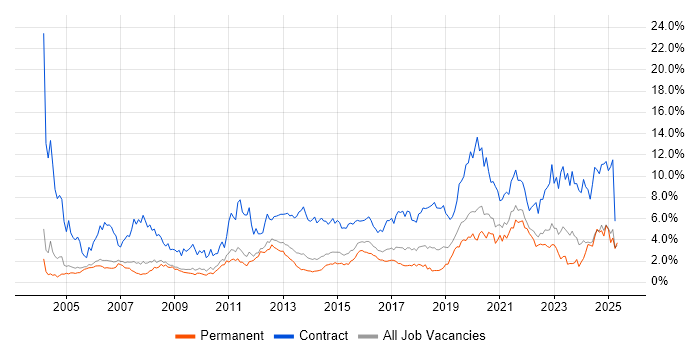
Job Vacancy Trend in Nottingham

Job postings citing Migration as a proportion of all IT jobs advertised in Nottingham.

Job vacancy trend for Migration in Nottingham

Migration
Salary Trend in Nottingham

3-month moving average salary quoted in jobs citing Migration in Nottingham.

Salary trend for Migration in Nottingham

Migration
Salary Histogram in Nottingham

Salary distribution for jobs citing Migration in Nottingham over the 6 months to 11 August 2025.

Salary histogram for Migration in Nottingham

Migration
Co-occurring Skills and Capabilities in Nottingham by Category

The follow tables expand on the table above by listing co-occurrences grouped by category. The same employment type, locality and period is covered with up to 20 co-occurrences shown in each of the following categories:

Application Platforms
1 5 (38.46%) Microsoft Exchange
2 1 (7.69%) IIS
Cloud Services
1 5 (38.46%) Microsoft 365
2 2 (15.38%) SaaS
3 1 (7.69%) AWS
3 1 (7.69%) Azure
3 1 (7.69%) Azure AI
3 1 (7.69%) Azure DevOps
3 1 (7.69%) Azure ExpressRoute
3 1 (7.69%) Azure Key Vault
3 1 (7.69%) Azure Monitor
3 1 (7.69%) Azure Service Bus
3 1 (7.69%) Entra ID
3 1 (7.69%) IaaS
3 1 (7.69%) PaaS
3 1 (7.69%) Power Automate
3 1 (7.69%) Power Platform
Communications & Networking
1 1 (7.69%) DNS
1 1 (7.69%) Firewall
1 1 (7.69%) SD-WAN
1 1 (7.69%) VPN
1 1 (7.69%) WAN
Database & Business Intelligence
1 3 (23.08%) BigQuery
1 3 (23.08%) Tableau
2 1 (7.69%) Data Lake
2 1 (7.69%) Metadata
2 1 (7.69%) MySQL
2 1 (7.69%) Oracle BI Publisher
2 1 (7.69%) Oracle ODI
2 1 (7.69%) Power BI
Development Applications
1 1 (7.69%) Git
General
1 5 (38.46%) Social Skills
2 3 (23.08%) Documentation Skills
3 2 (15.38%) Advertising
4 1 (7.69%) Banking
4 1 (7.69%) Finance
4 1 (7.69%) Organisational Skills
4 1 (7.69%) Retail Banking
Job Titles
1 5 (38.46%) 1st Line Support
1 5 (38.46%) IT Support
2 3 (23.08%) Analyst
2 3 (23.08%) Data Analyst
2 3 (23.08%) Data Quality Analyst
2 3 (23.08%) Quality Analyst
3 2 (15.38%) Architect
3 2 (15.38%) Consultant
3 2 (15.38%) Implementation Consultant
3 2 (15.38%) Software Consultant
3 2 (15.38%) Software Implementation Consultant
4 1 (7.69%) Cloud Architect
4 1 (7.69%) Data Architect
4 1 (7.69%) Data Consultant
4 1 (7.69%) Data Migration Consultant
4 1 (7.69%) Lead
4 1 (7.69%) Oracle Architect
4 1 (7.69%) Oracle Data Architect
4 1 (7.69%) Technical Leader
4 1 (7.69%) Workstream Lead
Libraries, Frameworks & Software Standards
1 2 (15.38%) XML
2 1 (7.69%) CSS
2 1 (7.69%) HTML
2 1 (7.69%) Oracle Fusion
2 1 (7.69%) REST
Miscellaneous
1 5 (38.46%) Onboarding
2 1 (7.69%) Data Centre
2 1 (7.69%) Data Structures
2 1 (7.69%) Legacy Systems
2 1 (7.69%) NHS
Operating Systems
1 5 (38.46%) Windows
Processes & Methodologies
1 5 (38.46%) Asset Management
2 3 (23.08%) Agile
2 3 (23.08%) Data Cleansing
2 3 (23.08%) Data Migration
2 3 (23.08%) Data Validation
2 3 (23.08%) Data Visualisation
2 3 (23.08%) Validation
2 3 (23.08%) Visualisation
3 2 (15.38%) Analytics
3 2 (15.38%) API Management
3 2 (15.38%) Data Integration
3 2 (15.38%) Problem-Solving
3 2 (15.38%) Project Delivery
4 1 (7.69%) Data Governance
4 1 (7.69%) Data Lineage
4 1 (7.69%) Data Strategy
4 1 (7.69%) DevOps
4 1 (7.69%) Infrastructure as Code
4 1 (7.69%) Network Virtualisation
4 1 (7.69%) Translating Business Requirements
Programming Languages
1 6 (46.15%) SQL
2 3 (23.08%) Python
3 2 (15.38%) C#
3 2 (15.38%) JavaScript
4 1 (7.69%) Bicep
4 1 (7.69%) PowerShell
Qualifications
1 1 (7.69%) Azure Certification
1 1 (7.69%) DBS Check
Quality Assurance & Compliance
1 5 (38.46%) SLA
2 4 (30.77%) Data Quality
System Software
1 5 (38.46%) Active Directory
2 1 (7.69%) Virtual Machines
Systems Management
1 1 (7.69%) Single Sign-On
Vendors
1 5 (38.46%) Microsoft
2 1 (7.69%) Databricks
2 1 (7.69%) Meraki
2 1 (7.69%) Oracle