Continuous Improvement Jobs in the South East

Continual Improvement
England > South East

The table below provides summary statistics for permanent job vacancies advertised in the South East requiring Continuous Improvement skills. It includes a benchmarking guide to the annual salaries offered in vacancies that cited Continuous Improvement over the 6 months leading up to 31 October 2024, comparing them to the same period in the previous two years.

6 months to
31 Oct 2024
Same period 2023 Same period 2022
Rank 22 60 44
Rank change year-on-year +38 -16 +16
Permanent jobs citing Continuous Improvement 875 369 1,213
As % of all permanent jobs advertised in the South East 7.12% 4.50% 6.56%
As % of the Processes & Methodologies category 8.60% 4.80% 6.87%
Number of salaries quoted 247 216 482
10th Percentile £40,013 £40,375 £34,000
25th Percentile £47,500 £50,000 £46,250
Median annual salary (50th Percentile) £62,500 £65,000 £60,000
Median % change year-on-year -3.85% +8.33% +6.19%
75th Percentile £76,750 £74,063 £73,188
90th Percentile £85,000 £82,500 £85,000
England median annual salary £60,000 £65,000 £60,000
% change year-on-year -7.69% +8.33% +0.13%

All Process and Methodology Skills
South East

Continuous Improvement falls under the Processes and Methodologies category. For comparison with the information above, the following table provides summary statistics for all permanent job vacancies requiring process or methodology skills in the South East.

Permanent vacancies with a requirement for process or methodology skills 10,173 7,684 17,655
As % of all permanent jobs advertised in the South East 82.73% 93.63% 95.45%
Number of salaries quoted 4,932 5,101 10,349
10th Percentile £33,275 £31,250 £31,250
25th Percentile £42,500 £41,250 £42,000
Median annual salary (50th Percentile) £55,000 £55,000 £55,000
Median % change year-on-year - - +4.76%
75th Percentile £70,000 £70,000 £72,500
90th Percentile £84,875 £82,500 £83,750
England median annual salary £60,000 £60,000 £60,000
% change year-on-year - - +3.45%

Continuous Improvement
Job Vacancy Trend in the South East

Job postings citing Continuous Improvement as a proportion of all IT jobs advertised in the South East.
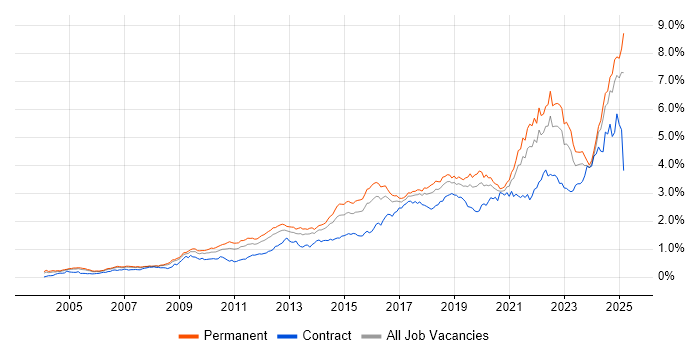
Job vacancy trend for Continuous Improvement in the South East

Continuous Improvement
Salary Trend in the South East

3-month moving average salary quoted in jobs citing Continuous Improvement in the South East.

Salary trend for Continuous Improvement in the South East

Continuous Improvement
Salary Histogram in the South East

Salary distribution for jobs citing Continuous Improvement in the South East over the 6 months to 31 October 2024.

Salary histogram for Continuous Improvement in the South East

Continuous Improvement
Job Locations in the South East

The table below looks at the demand and provides a guide to the median salaries quoted in IT jobs citing Continuous Improvement within the South East region over the 6 months to 31 October 2024. The 'Rank Change' column provides an indication of the change in demand within each location based on the same 6 month period last year.

Location Rank Change
on Same Period
Last Year
Matching
Permanent
IT Job Ads
Median Salary
Past 6 Months
Median Salary
% Change
on Same Period
Last Year
Live
Jobs
Thames Valley +35 391 £56,509 -1.72% 66
Berkshire +50 215 £55,000 +4.66% 33
Hampshire +31 189 £65,000 -5.11% 44
Buckinghamshire +29 116 £50,000 -25.93% 21
Surrey +25 95 £65,000 - 22
Kent +5 67 £45,000 -14.29% 14
East Sussex +24 61 £75,000 +7.14% 8
Oxfordshire -14 60 £58,250 +1.30% 12
West Sussex +23 35 £55,000 -24.14% 12
Sussex - 22 £90,000 -
Isle of Wight - 20 - - 3
Continuous Improvement
England

Continuous Improvement
Co-occurring Skills and Capabilities in the South East by Category

The follow tables expand on the table above by listing co-occurrences grouped by category. The same employment type, locality and period is covered with up to 20 co-occurrences shown in each of the following categories:

Application Platforms
1 33 (3.77%) SharePoint
2 12 (1.37%) Confluence
2 12 (1.37%) Microsoft Exchange
3 5 (0.57%) Apache Airflow
4 4 (0.46%) Apache
5 3 (0.34%) Apache Spark
5 3 (0.34%) OpenStack
6 1 (0.11%) CMS
Applications
1 74 (8.46%) Microsoft Excel
2 67 (7.66%) Microsoft Office
3 30 (3.43%) Microsoft Project
4 11 (1.26%) Microsoft PowerPoint
5 4 (0.46%) Siemens NX
5 4 (0.46%) Sketch
6 3 (0.34%) Acrobat
7 1 (0.11%) MS Visio
7 1 (0.11%) Spreadsheet
Business Applications
1 11 (1.26%) Dynamics CRM
2 9 (1.03%) Primavera
3 6 (0.69%) SAP S/4HANA
4 4 (0.46%) Shopify
4 4 (0.46%) Teamcenter
4 4 (0.46%) Unit4 Business World
5 3 (0.34%) Salesforce CRM
6 2 (0.23%) SAP Business One
6 2 (0.23%) SAP ERP
7 1 (0.11%) SAP CO
7 1 (0.11%) SAP FI
7 1 (0.11%) SAP FI/CO
7 1 (0.11%) Sparx Enterprise Architect
Cloud Services
1 110 (12.57%) Azure
2 85 (9.71%) AWS
3 60 (6.86%) Power Platform
4 59 (6.74%) GCP
5 55 (6.29%) Microsoft 365
6 32 (3.66%) Azure DevOps
7 31 (3.54%) SaaS
8 23 (2.63%) IBM Cloud
9 22 (2.51%) IaaS
9 22 (2.51%) PaaS
10 17 (1.94%) Azure Data Factory
11 16 (1.83%) GitHub
12 15 (1.71%) GitHub Actions
13 14 (1.60%) Serverless
14 12 (1.37%) Azure Synapse Analytics
15 10 (1.14%) Azure Functions
16 9 (1.03%) Azure API Management
16 9 (1.03%) Azure Monitor
17 8 (0.91%) Azure Key Vault
17 8 (0.91%) Azure Sentinel
Communications & Networking
1 106 (12.11%) Wireless
2 104 (11.89%) LTE
3 98 (11.20%) 5G
3 98 (11.20%) Bluetooth
3 98 (11.20%) GSM
3 98 (11.20%) UMTS
3 98 (11.20%) Wi-Fi
4 48 (5.49%) Firewall
5 44 (5.03%) Broadband
6 25 (2.86%) OSPF
6 25 (2.86%) WAN
7 20 (2.29%) Intranet
8 17 (1.94%) LAN
9 15 (1.71%) BGP
9 15 (1.71%) VLAN
10 14 (1.60%) TCP/IP
11 13 (1.49%) Network Security
12 11 (1.26%) Internet
13 8 (0.91%) SNMP
14 7 (0.80%) DNS
Database & Business Intelligence
1 41 (4.69%) Data Hub
2 35 (4.00%) Power BI
3 18 (2.06%) SQL Server
4 11 (1.26%) Azure SQL Database
4 11 (1.26%) Data Lake
5 10 (1.14%) Data Warehouse
6 9 (1.03%) PostgreSQL
7 8 (0.91%) Power Query
7 8 (0.91%) Relational Database
8 7 (0.80%) MySQL
9 5 (0.57%) Big Data
9 5 (0.57%) GIS
9 5 (0.57%) NoSQL
10 4 (0.46%) Metadata
10 4 (0.46%) Parquet
10 4 (0.46%) Redis
11 3 (0.34%) DTS
11 3 (0.34%) Hadoop
12 2 (0.23%) Microsoft Analysis Services
12 2 (0.23%) SQL Server Integration Services
Development Applications
1 36 (4.11%) JIRA
2 35 (4.00%) Git
3 20 (2.29%) Selenium
4 11 (1.26%) SonarQube
5 10 (1.14%) Artifactory
6 9 (1.03%) Jenkins
7 7 (0.80%) GitLab
8 6 (0.69%) Cypress.io
9 5 (0.57%) Rational DOORS
10 4 (0.46%) JUnit
10 4 (0.46%) NUnit
10 4 (0.46%) TestNG
10 4 (0.46%) Visual Studio
11 3 (0.34%) Appium
12 2 (0.23%) Burp Suite
12 2 (0.23%) Metasploit
12 2 (0.23%) Postman
12 2 (0.23%) SoapUI
13 1 (0.11%) REST Assured
13 1 (0.11%) Terragrunt
General
1 347 (39.66%) Social Skills
2 136 (15.54%) Analytical Skills
3 126 (14.40%) Automotive
4 116 (13.26%) Finance
5 113 (12.91%) Inclusion and Diversity
6 95 (10.86%) Manufacturing
7 62 (7.09%) Telecoms
8 51 (5.83%) Influencing Skills
9 43 (4.91%) Legal
10 40 (4.57%) Marketing
11 38 (4.34%) Public Sector
12 28 (3.20%) Electronics
13 27 (3.09%) Organisational Skills
14 22 (2.51%) Retail
15 20 (2.29%) Law
16 19 (2.17%) Aerospace
17 17 (1.94%) Billing
17 17 (1.94%) Presentation Skills
18 15 (1.71%) Military
19 13 (1.49%) Pharmaceutical
Job Titles
1 166 (18.97%) Senior
2 119 (13.60%) Analyst
3 106 (12.11%) Test Engineer
4 102 (11.66%) Lead
5 97 (11.09%) EMC Engineer
5 97 (11.09%) EMC Test Engineer
6 55 (6.29%) Project Manager
7 49 (5.60%) Senior Analyst
8 46 (5.26%) Developer
9 44 (5.03%) IT Analyst
10 33 (3.77%) Audit Analyst
11 30 (3.43%) Senior Manager
12 27 (3.09%) Engineering Manager
13 25 (2.86%) Graduate
14 23 (2.63%) AWS Engineer
14 23 (2.63%) Full-Stack Engineer
15 20 (2.29%) Senior Systems Engineer
16 19 (2.17%) Architect
17 18 (2.06%) Administrator
18 17 (1.94%) Software Engineer
Libraries, Frameworks & Software Standards
1 45 (5.14%) HTML
2 44 (5.03%) CSS
2 44 (5.03%) React
3 25 (2.86%) .NET
4 14 (1.60%) Middleware
5 13 (1.49%) Node.js
6 11 (1.26%) RESTful
7 10 (1.14%) 802.1X
7 10 (1.14%) AngularJS
8 9 (1.03%) EDI
8 9 (1.03%) Redux
8 9 (1.03%) REST
8 9 (1.03%) Web Services
9 8 (0.91%) Spring
10 7 (0.80%) XML
11 6 (0.69%) J2SE
11 6 (0.69%) OpenMP
11 6 (0.69%) Spring Boot
11 6 (0.69%) Vue
12 5 (0.57%) React Native
Miscellaneous
1 98 (11.20%) Satnav
2 62 (7.09%) Self-Motivation
3 44 (5.03%) Management Information System
4 39 (4.46%) Driving Licence
5 38 (4.34%) Product Ownership
6 36 (4.11%) Hybrid Cloud
7 23 (2.63%) Blockchain
7 23 (2.63%) Data Centre
7 23 (2.63%) Virtual Team
8 19 (2.17%) Acoustics
8 19 (2.17%) Onboarding
9 14 (1.60%) Algorithms
9 14 (1.60%) IoT
10 12 (1.37%) Enterprise Software
10 12 (1.37%) FMCG
11 9 (1.03%) Analytical Mindset
11 9 (1.03%) Cyber Threat
11 9 (1.03%) Data Protection Act
11 9 (1.03%) Mobile App
12 8 (0.91%) Digital Media
Operating Systems
1 44 (5.03%) Windows
2 31 (3.54%) Linux
3 12 (1.37%) Windows Server
4 4 (0.46%) Mac OS
4 4 (0.46%) Red Hat Enterprise Linux
4 4 (0.46%) Ubuntu
5 3 (0.34%) Android
5 3 (0.34%) SUSE Linux Enterprise Server
5 3 (0.34%) Unix
5 3 (0.34%) VMS
6 2 (0.23%) Mac OS X
7 1 (0.11%) CentOS
Processes & Methodologies
1 299 (34.17%) Problem-Solving
2 181 (20.69%) Data Management
3 160 (18.29%) Agile
4 135 (15.43%) Project Management
4 135 (15.43%) Test Automation
5 109 (12.46%) Test Scripting
6 107 (12.23%) Customer Experience
7 91 (10.40%) Mentoring
8 87 (9.94%) Data Analysis
9 83 (9.49%) ITIL
10 81 (9.26%) Analytics
10 81 (9.26%) Change Management
11 80 (9.14%) Computer Science
12 78 (8.91%) Decision-Making
13 71 (8.11%) Risk Management
14 70 (8.00%) Information Security
15 69 (7.89%) Coaching
16 68 (7.77%) Customer Service
17 66 (7.54%) DevOps
18 64 (7.31%) Project Delivery
Programming Languages
1 74 (8.46%) Python
2 70 (8.00%) SQL
3 63 (7.20%) C#
4 52 (5.94%) JavaScript
5 48 (5.49%) PowerShell
6 44 (5.03%) Java
7 32 (3.66%) TypeScript
8 23 (2.63%) Bash
9 10 (1.14%) MATLAB
10 9 (1.03%) C++
11 7 (0.80%) PHP
12 6 (0.69%) C
12 6 (0.69%) C-shell
12 6 (0.69%) Fortran
13 4 (0.46%) Data Analysis Expressions
14 2 (0.23%) Kotlin
14 2 (0.23%) Uniface
15 1 (0.11%) PL/SQL
15 1 (0.11%) Ruby
15 1 (0.11%) T-SQL
Qualifications
1 347 (39.66%) Degree
2 66 (7.54%) Security Cleared
3 42 (4.80%) CISA
4 29 (3.31%) Computer Science Degree
4 29 (3.31%) SC Cleared
5 28 (3.20%) Azure Certification
6 27 (3.09%) Master's Degree
7 26 (2.97%) NVQ Level 3
8 20 (2.29%) Chartered Engineer
9 16 (1.83%) ITIL Certification
10 15 (1.71%) ACCA
10 15 (1.71%) CIMA
10 15 (1.71%) CISSP
10 15 (1.71%) Microsoft Certification
11 14 (1.60%) Cisco Certification
12 13 (1.49%) PMI Certification
13 12 (1.37%) PMP
14 10 (1.14%) DV Cleared
15 9 (1.03%) BPSS Clearance
16 8 (0.91%) CompTIA Security+
Quality Assurance & Compliance
1 56 (6.40%) SLA
2 49 (5.60%) Sarbanes-Oxley
3 45 (5.14%) QA
4 31 (3.54%) GDPR
5 16 (1.83%) ISO/IEC 27001
6 13 (1.49%) Cyber Essentials
7 11 (1.26%) Data Quality
7 11 (1.26%) NIST
8 10 (1.14%) Solvency II
9 9 (1.03%) PMO
10 8 (0.91%) PCI DSS
11 6 (0.69%) GMP
12 5 (0.57%) SOC 2
13 4 (0.46%) GRC
13 4 (0.46%) NIST 800
14 3 (0.34%) GxP
14 3 (0.34%) HIPAA
14 3 (0.34%) Software Quality Assurance
15 2 (0.23%) Accessibility
15 2 (0.23%) ISO 9001
System Software
1 24 (2.74%) Docker
2 23 (2.63%) Active Directory
3 14 (1.60%) VMware Infrastructure
4 13 (1.49%) Firmware
5 5 (0.57%) Virtual Machines
6 4 (0.46%) Hyper-V
6 4 (0.46%) Virtual Desktop
7 3 (0.34%) Ceph
7 3 (0.34%) GPFS
7 3 (0.34%) Lustre
7 3 (0.34%) Slurm Workload Manager
7 3 (0.34%) VMware NSX
7 3 (0.34%) vSphere
Systems Management
1 24 (2.74%) Kubernetes
2 21 (2.40%) Terraform
3 8 (0.91%) Prometheus
4 7 (0.80%) Ansible
4 7 (0.80%) Grafana
5 5 (0.57%) Microsoft Intune
6 4 (0.46%) Podman
7 3 (0.34%) vRealize
7 3 (0.34%) vRealize Orchestrator
8 2 (0.23%) McAfee ePO
8 2 (0.23%) Nmap
8 2 (0.23%) QRadar
9 1 (0.11%) Argo
9 1 (0.11%) Backup Exec
9 1 (0.11%) Consul
9 1 (0.11%) FTK
Vendors
1 175 (20.00%) Microsoft
2 98 (11.20%) EMC
3 53 (6.06%) Google
4 33 (3.77%) SAP
5 28 (3.20%) IBM
6 27 (3.09%) Red Hat
7 23 (2.63%) Cisco
8 17 (1.94%) Databricks
8 17 (1.94%) Extreme Networks
9 16 (1.83%) VMware
10 12 (1.37%) Sony
11 11 (1.26%) Fortinet
12 10 (1.14%) Oracle
12 10 (1.14%) Remedy
12 10 (1.14%) Veracode
13 9 (1.03%) Dynatrace
14 6 (0.69%) HP
14 6 (0.69%) McAfee
14 6 (0.69%) Salesforce
14 6 (0.69%) ServiceNow