Cisco Jobs in the City of London

Cisco
Central London > City of London

The table below provides summary statistics for permanent job vacancies advertised in the City of London with a requirement for knowledge and experience of Cisco products and/or services. Included is a benchmarking guide to the salaries offered in vacancies that have cited Cisco over the 6 months to 7 May 2024 with a comparison to the same period in the previous 2 years.

The figures below represent the IT labour market in general and are not representative of salaries within Cisco Systems, Inc.

6 months to
7 May 2024
Same period 2023 Same period 2022
Rank 79 92 151
Rank change year-on-year +13 +59 -35
Permanent jobs citing Cisco 109 150 142
As % of all permanent jobs advertised in the City of London 3.26% 3.24% 1.99%
As % of the Vendors category 8.44% 8.26% 5.63%
Number of salaries quoted 80 114 102
10th Percentile £37,000 £35,000 £36,250
25th Percentile £46,250 £42,500 £52,500
Median annual salary (50th Percentile) £65,000 £58,250 £62,500
Median % change year-on-year +11.59% -6.80% -
75th Percentile £78,750 £67,500 £75,000
90th Percentile £92,500 £72,125 £82,500
Central London median annual salary £65,000 £58,250 £62,000
% change year-on-year +11.59% -6.05% -0.80%

All Vendors
City of London

Cisco is in the Vendor Products and Services category. The following table is for comparison with the above and provides summary statistics for all permanent job vacancies with a requirement for knowledge or experience of vendor products and services advertised in the City of London.

Permanent vacancies with a requirement for knowledge or experience of vendor products and services 1,292 1,815 2,521
As % of all permanent jobs advertised in the City of London 38.66% 39.21% 35.34%
Number of salaries quoted 983 1,430 1,838
10th Percentile £37,000 £37,225 £40,000
25th Percentile £47,750 £50,000 £51,250
Median annual salary (50th Percentile) £70,000 £69,000 £67,500
Median % change year-on-year +1.45% +2.22% -3.57%
75th Percentile £87,500 £90,000 £86,250
90th Percentile £105,000 £106,250 £101,250
Central London median annual salary £67,500 £67,500 £65,000
% change year-on-year - +3.85% -3.70%

Cisco
Job Vacancy Trend in the City of London

Job postings citing Cisco as a proportion of all IT jobs advertised in the City of London.
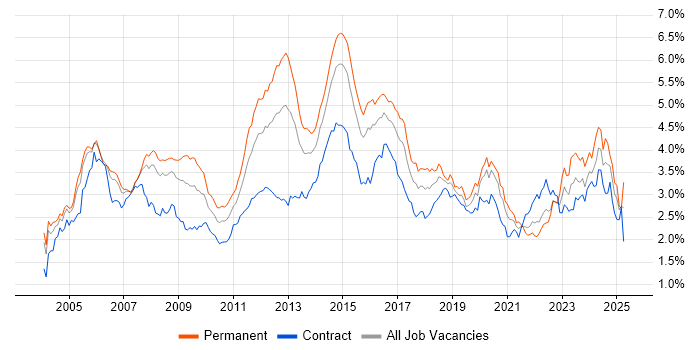
Job vacancy trend for Cisco in the City of London

Cisco
Salary Trend in the City of London

3-month moving average salary quoted in jobs citing Cisco in the City of London.

Salary trend for Cisco in the City of London

Cisco
Salary Histogram in the City of London

Salary distribution for jobs citing Cisco in the City of London over the 6 months to 7 May 2024.

Salary histogram for Cisco in the City of London

Cisco
Co-occurring Skills and Capabilities in the City of London by Category

The follow tables expand on the table above by listing co-occurrences grouped by category. The same employment type, locality and period is covered with up to 20 co-occurrences shown in each of the following categories:

Application Platforms
1 24 (22.02%) Skype for Business
2 11 (10.09%) Microsoft Exchange
3 9 (8.26%) SharePoint
4 4 (3.67%) IIS
5 3 (2.75%) Exchange Server 2010
Applications
1 36 (33.03%) Microsoft Office
2 4 (3.67%) Microsoft Excel
2 4 (3.67%) MS Visio
Cloud Services
1 54 (49.54%) Azure
2 50 (45.87%) Microsoft 365
3 12 (11.01%) AWS
3 12 (11.01%) Rubrik
4 9 (8.26%) Entra ID
5 8 (7.34%) Azure DevOps
6 6 (5.50%) Datadog
6 6 (5.50%) IaaS
6 6 (5.50%) PaaS
6 6 (5.50%) SaaS
7 5 (4.59%) Cloud Computing
7 5 (4.59%) Mimecast
8 4 (3.67%) GCP
9 3 (2.75%) WhatsApp
10 2 (1.83%) Azure ExpressRoute
10 2 (1.83%) Azure Storage
10 2 (1.83%) Google Workspace
10 2 (1.83%) Nutanix
10 2 (1.83%) OneDrive
11 1 (0.92%) GitHub
Communications & Networking
1 28 (25.69%) Cisco IOS
1 28 (25.69%) Telepresence
2 25 (22.94%) Skype
2 25 (22.94%) WAN
3 20 (18.35%) LAN
4 19 (17.43%) Firewall
5 18 (16.51%) Network Security
6 17 (15.60%) Wi-Fi
7 16 (14.68%) Wireless
8 12 (11.01%) SAN
8 12 (11.01%) WebEx
9 11 (10.09%) SD-WAN
10 10 (9.17%) DNS
10 10 (9.17%) VPN
11 9 (8.26%) NAS
12 7 (6.42%) DHCP
13 6 (5.50%) NetScaler
14 5 (4.59%) BGP
14 5 (4.59%) MPLS
14 5 (4.59%) PBX
Database & Business Intelligence
1 6 (5.50%) SQL Server
2 2 (1.83%) Amazon RDS
2 2 (1.83%) Metadata
3 1 (0.92%) RDBMS
3 1 (0.92%) Relational Database
Development Applications
1 2 (1.83%) Jenkins
2 1 (0.92%) Octopus Deploy
General
1 37 (33.94%) Finance
2 27 (24.77%) Telecoms
3 24 (22.02%) Automotive
3 24 (22.02%) Pharmaceutical
4 22 (20.18%) Social Skills
5 8 (7.34%) Law
5 8 (7.34%) Legal
5 8 (7.34%) Multimedia
6 7 (6.42%) Analytical Skills
7 5 (4.59%) Organisational Skills
8 3 (2.75%) Documentation Skills
8 3 (2.75%) Japanese Language
8 3 (2.75%) Presentation Skills
9 2 (1.83%) Banking
9 2 (1.83%) Manufacturing
10 1 (0.92%) Advertising
10 1 (0.92%) Games
10 1 (0.92%) Inclusion and Diversity
10 1 (0.92%) Public Sector
10 1 (0.92%) Retail
Job Titles
1 31 (28.44%) Senior
2 24 (22.02%) Network Engineer
3 23 (21.10%) Support Engineer
4 15 (13.76%) Senior Network Engineer
5 10 (9.17%) Infrastructure Engineer
6 9 (8.26%) Analyst
7 8 (7.34%) VMware Engineer
8 7 (6.42%) Graduate
8 7 (6.42%) Graduate Support Engineer
8 7 (6.42%) Lead
8 7 (6.42%) Senior VMware Engineer
9 6 (5.50%) Audio Visual Technician
9 6 (5.50%) Security Engineer
9 6 (5.50%) Senior Infrastructure Engineer
9 6 (5.50%) VMware Infrastructure Engineer
10 5 (4.59%) Cisco Engineer
10 5 (4.59%) Cisco Network Engineer
10 5 (4.59%) Support Analyst
10 5 (4.59%) Support Specialist
10 5 (4.59%) Support Technician
Libraries, Frameworks & Software Standards
1 4 (3.67%) XMPP
2 3 (2.75%) 802.1X
3 2 (1.83%) ARM Templates
4 1 (0.92%) ADSI
4 1 (0.92%) RabbitMQ
Miscellaneous
1 33 (30.28%) Video Conferencing
2 9 (8.26%) Data Centre
3 7 (6.42%) Blackberry
4 4 (3.67%) Linux Command Line
5 3 (2.75%) iPhone
6 2 (1.83%) CCTV
6 2 (1.83%) e-Learning
6 2 (1.83%) Hybrid Cloud
6 2 (1.83%) PKI
6 2 (1.83%) Replication
7 1 (0.92%) Analytical Mindset
7 1 (0.92%) Distributed Denial-of-Service
7 1 (0.92%) FlexPod
7 1 (0.92%) iPad
7 1 (0.92%) Management Information System
Operating Systems
1 70 (64.22%) Windows
2 47 (43.12%) Windows 10
3 29 (26.61%) Windows 7
4 26 (23.85%) Windows Server
5 14 (12.84%) Windows Server 2016
6 12 (11.01%) Linux
7 9 (8.26%) Windows Server 2012
8 5 (4.59%) Windows Server 2019
9 3 (2.75%) Android
10 2 (1.83%) Mac OS X
11 1 (0.92%) CentOS
11 1 (0.92%) Mac OS
Processes & Methodologies
1 38 (34.86%) ITIL
2 17 (15.60%) Stakeholder Management
3 16 (14.68%) Problem-Solving
4 13 (11.93%) Infrastructure Engineering
5 12 (11.01%) Project Management
6 11 (10.09%) Change Control
6 11 (10.09%) Continuous Improvement
6 11 (10.09%) Customer Service
7 10 (9.17%) DevOps
8 8 (7.34%) Change Management
9 7 (6.42%) ITSM
9 7 (6.42%) Load Balancing
10 6 (5.50%) Computer Science
10 6 (5.50%) Network Management
10 6 (5.50%) Service Delivery
10 6 (5.50%) Vulnerability Management
11 5 (4.59%) Digital Forensics
11 5 (4.59%) Incident Management
11 5 (4.59%) Information Security
11 5 (4.59%) Time Management
Programming Languages
1 13 (11.93%) PowerShell
2 7 (6.42%) SQL
3 5 (4.59%) Bash
Qualifications
1 40 (36.70%) Degree
2 28 (25.69%) ITIL Foundation Certificate
3 24 (22.02%) Master's Degree
3 24 (22.02%) MBA
4 14 (12.84%) Cisco Certification
5 9 (8.26%) CCNP
6 6 (5.50%) CCNA
6 6 (5.50%) Microsoft Certification
7 4 (3.67%) CCIE
8 3 (2.75%) Azure Certification
9 2 (1.83%) JNCIP
9 2 (1.83%) MCSE
9 2 (1.83%) VMware Certified Professional (VCP)
10 1 (0.92%) TOGAF Certification
Quality Assurance & Compliance
1 3 (2.75%) ISO/IEC 27001
1 3 (2.75%) SLA
2 2 (1.83%) NIST
2 2 (1.83%) PCI DSS
System Software
1 31 (28.44%) Active Directory
2 16 (14.68%) VMware Infrastructure
3 9 (8.26%) vSphere
4 7 (6.42%) Virtual Machines
5 5 (4.59%) VMware ESXi
6 3 (2.75%) Virtual Servers
7 2 (1.83%) Firmware
8 1 (0.92%) Docker
8 1 (0.92%) Hyper-V
8 1 (0.92%) pfSense
Systems Management
1 8 (7.34%) SCCM
2 7 (6.42%) Microsoft Intune
3 5 (4.59%) CASB
3 5 (4.59%) QRadar
3 5 (4.59%) vCenter Server
4 4 (3.67%) DatAdvantage
4 4 (3.67%) Single Sign-On
5 3 (2.75%) Active Directory Federation Services
5 3 (2.75%) Backup Exec
5 3 (2.75%) FortiGate
5 3 (2.75%) Jamf Pro
5 3 (2.75%) Terraform
6 2 (1.83%) Ansible
6 2 (1.83%) HP SIM
6 2 (1.83%) Packer
6 2 (1.83%) PowerCLI
6 2 (1.83%) SCOM
6 2 (1.83%) SCOrch
6 2 (1.83%) vRealize Orchestrator
6 2 (1.83%) WSUS
Vendors
1 64 (58.72%) Microsoft
2 28 (25.69%) Apple
3 27 (24.77%) VMware
4 24 (22.02%) Polycom
5 19 (17.43%) SolarWinds
6 18 (16.51%) Palo Alto
7 16 (14.68%) Citrix
7 16 (14.68%) NetApp
8 15 (13.76%) HP
8 15 (13.76%) Meraki
9 14 (12.84%) Veeam
10 11 (10.09%) Aruba
10 11 (10.09%) Commvault
11 6 (5.50%) iManage
11 6 (5.50%) Juniper
11 6 (5.50%) LogicMonitor
11 6 (5.50%) Remedy
12 5 (4.59%) Kenna
12 5 (4.59%) Mitel
12 5 (4.59%) Rapid7