Cisco Contracts in the City of London

Cisco
Central London > City of London

The table below provides summary statistics for contract job vacancies advertised in the City of London requiring knowledge or experience of Cisco products and/or services. It includes a benchmarking guide to contractor rates offered in vacancies that cited Cisco over the 6 months leading up to 5 July 2025, comparing them to the same period in the previous two years.

The figures below represent the IT contractor job market in general and are not representative of contractor rates within Cisco Systems, Inc.

6 months to
5 Jul 2025
Same period 2024 Same period 2023
Rank 78 63 91
Rank change year-on-year -15 +28 -15
Contract jobs citing Cisco 44 68 76
As % of all contract jobs advertised in the City of London 2.42% 3.18% 2.16%
As % of the Vendors category 5.22% 7.10% 5.37%
Number of daily rates quoted 27 43 51
10th Percentile £290 £240 £158
25th Percentile £500 £250 £273
Median daily rate (50th Percentile) £540 £350 £500
Median % change year-on-year +54.29% -30.00% +29.87%
75th Percentile £631 £538 £630
90th Percentile £775 £635 £681
Central London median daily rate £536 £406 £425
% change year-on-year +31.94% -4.41% +5.59%
Number of hourly rates quoted 1 1 0
10th Percentile - - -
25th Percentile £61.86 £20.50 -
Median hourly rate £63.72 £21.00 -
Median % change year-on-year +203.40% - -
75th Percentile £65.57 £21.50 -
90th Percentile - - -
Central London median hourly rate £63.72 £21.00 -
% change year-on-year +203.40% - -

All Vendors
City of London

Cisco falls under the Vendor Products and Services category. For comparison with the information above, the following table provides summary statistics for all contract job vacancies requiring knowledge or experience of all vendor products and services in the City of London.

Contract vacancies with a requirement for knowledge or experience of vendor products and services 843 958 1,416
As % of all contract IT jobs advertised in the City of London 46.40% 44.79% 40.27%
Number of daily rates quoted 524 696 949
10th Percentile £313 £338 £262
25th Percentile £425 £450 £450
Median daily rate (50th Percentile) £550 £556 £563
Median % change year-on-year -0.99% -1.24% +2.27%
75th Percentile £675 £675 £700
90th Percentile £750 £785 £813
Central London median daily rate £550 £550 £550
Number of hourly rates quoted 14 9 8
10th Percentile £22.53 £12.75 £15.30
25th Percentile £26.91 £16.00 £19.32
Median hourly rate £38.58 £21.00 £36.25
Median % change year-on-year +83.69% -42.07% +36.79%
75th Percentile £63.75 £27.00 £52.81
90th Percentile £89.67 £51.35 £53.23
Central London median hourly rate £32.83 £21.00 £25.00
% change year-on-year +56.31% -16.00% -24.24%

Cisco
Job Vacancy Trend in the City of London

Job postings citing Cisco as a proportion of all IT jobs advertised in the City of London.
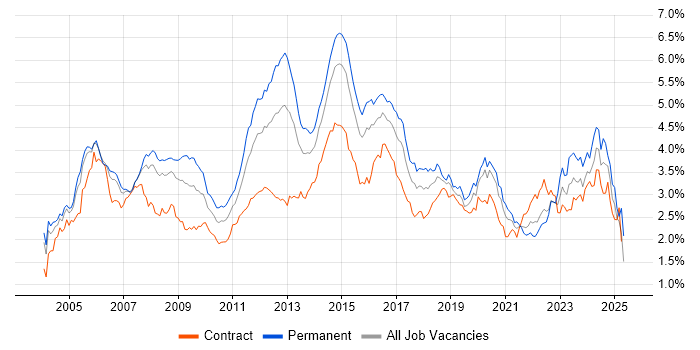
Job vacancy trend for Cisco in the City of London

Cisco
Contractor Daily Rate Trend in the City of London

3-month moving average daily rate quoted in jobs citing Cisco in the City of London.

Daily rate trend for Cisco in the City of London

Cisco
Daily Rate Histogram in the City of London

Daily rate distribution for jobs citing Cisco in the City of London over the 6 months to 5 July 2025.

Daily rate histogram for Cisco in the City of London

Cisco
Contractor Hourly Rate Trend in the City of London

3-month moving average hourly rates quoted in jobs citing Cisco in the City of London.

Hourly rate trend for Cisco in the City of London

Cisco
Co-occurring Skills and Capabilities in the City of London by Category

The follow tables expand on the table above by listing co-occurrences grouped by category. The same employment type, locality and period is covered with up to 20 co-occurrences shown in each of the following categories:

Application Platforms
1 2 (4.55%) Confluence
Applications
1 3 (6.82%) MS Visio
2 2 (4.55%) Microsoft Excel
3 1 (2.27%) Microsoft Office
Cloud Services
1 15 (34.09%) Azure
2 5 (11.36%) Entra ID
2 5 (11.36%) Microsoft 365
3 2 (4.55%) AWS
4 1 (2.27%) Azure DevOps
4 1 (2.27%) GCP
4 1 (2.27%) Nutanix
Communications & Networking
1 20 (45.45%) Firewall
2 7 (15.91%) WAN
3 6 (13.64%) BGP
3 6 (13.64%) Network Security
4 5 (11.36%) DNS
4 5 (11.36%) LAN
4 5 (11.36%) OSPF
4 5 (11.36%) SD-WAN
4 5 (11.36%) Wi-Fi
5 4 (9.09%) Cisco ASA
5 4 (9.09%) Cisco Nexus
5 4 (9.09%) SAN
5 4 (9.09%) Software-Defined Networking
6 3 (6.82%) DHCP
6 3 (6.82%) VoIP
7 2 (4.55%) MPLS
7 2 (4.55%) Unified Communications
7 2 (4.55%) VPN
7 2 (4.55%) WebEx
7 2 (4.55%) WLAN
Database & Business Intelligence
1 1 (2.27%) Oracle Database
1 1 (2.27%) SQL Server
Development Applications
1 4 (9.09%) JIRA
2 2 (4.55%) Sonatype Nexus
3 1 (2.27%) eggPlant
3 1 (2.27%) Git
General
1 14 (31.82%) Finance
2 13 (29.55%) Social Skills
3 7 (15.91%) Analytical Skills
3 7 (15.91%) Banking
4 4 (9.09%) Public Sector
5 2 (4.55%) Documentation Skills
5 2 (4.55%) Organisational Skills
5 2 (4.55%) Retail Banking
6 1 (2.27%) Investment Banking
6 1 (2.27%) Legal
6 1 (2.27%) Military
6 1 (2.27%) Multimedia
6 1 (2.27%) Police
6 1 (2.27%) Presentation Skills
6 1 (2.27%) Telecoms
Job Titles
1 9 (20.45%) Architect
1 9 (20.45%) Network Engineer
2 7 (15.91%) Network Architect
3 4 (9.09%) Active Directory Support
3 4 (9.09%) Infrastructure Support
3 4 (9.09%) Project Manager
4 3 (6.82%) Cisco Project Manager
4 3 (6.82%) Senior
4 3 (6.82%) Technical Architect
5 2 (4.55%) Cisco Architect
5 2 (4.55%) Cisco Network Architect
5 2 (4.55%) Data Centre Engineer
5 2 (4.55%) Infrastructure Engineer
5 2 (4.55%) IT Engineer
5 2 (4.55%) IT Support
5 2 (4.55%) Network Project Manager
5 2 (4.55%) Security Engineer
5 2 (4.55%) Senior Data Warehouse Specialist
5 2 (4.55%) Solutions Architect
5 2 (4.55%) Technical Solutions Architect
Libraries, Frameworks & Software Standards
1 1 (2.27%) WebRTC
Miscellaneous
1 9 (20.45%) Data Centre
2 2 (4.55%) Enterprise Storage
2 2 (4.55%) Onboarding
3 1 (2.27%) CCTV
3 1 (2.27%) Clustering
3 1 (2.27%) Digital Signage
3 1 (2.27%) Fat Client
3 1 (2.27%) Greenfield Project
3 1 (2.27%) Hybrid Cloud
3 1 (2.27%) Management Information System
3 1 (2.27%) Self-Motivation
3 1 (2.27%) Thin Client
3 1 (2.27%) Virtual Team
Operating Systems
1 5 (11.36%) Windows
2 1 (2.27%) Windows Server
2 1 (2.27%) Windows Server 2012
2 1 (2.27%) Windows Server 2016
2 1 (2.27%) Windows Server 2019
Processes & Methodologies
1 7 (15.91%) Problem-Solving
2 6 (13.64%) Infrastructure Engineering
2 6 (13.64%) Project Management
2 6 (13.64%) Stakeholder Management
3 5 (11.36%) ITIL
4 4 (9.09%) Asset Management
4 4 (9.09%) DevOps
4 4 (9.09%) Network Design
4 4 (9.09%) Network Management
4 4 (9.09%) Patch Management
4 4 (9.09%) Roadmaps
5 3 (6.82%) Cloud Security
5 3 (6.82%) Cybersecurity
5 3 (6.82%) High Availability
5 3 (6.82%) Low Latency
5 3 (6.82%) SDLC
5 3 (6.82%) Security Patching
5 3 (6.82%) Technology Roadmap
6 2 (4.55%) Electronic Trading
6 2 (4.55%) Time Management
Programming Languages
1 5 (11.36%) Python
2 4 (9.09%) SQL
3 1 (2.27%) PowerShell
Qualifications
1 15 (34.09%) Cisco Certification
2 11 (25.00%) Security Cleared
3 10 (22.73%) CCNP
4 8 (18.18%) SC Cleared
5 6 (13.64%) CCNA
6 4 (9.09%) CCIE
6 4 (9.09%) Degree
7 2 (4.55%) Azure Certification
7 2 (4.55%) ITIL Certification
8 1 (2.27%) AWS Certification
8 1 (2.27%) CCSE
8 1 (2.27%) DV Cleared
8 1 (2.27%) JNCIE
8 1 (2.27%) JNCIP
8 1 (2.27%) JNCIS
8 1 (2.27%) Network+ Certification
Quality Assurance & Compliance
1 1 (2.27%) ISO/IEC 27001
1 1 (2.27%) NIST
1 1 (2.27%) PCI DSS
1 1 (2.27%) QA
1 1 (2.27%) SLA
System Software
1 6 (13.64%) Active Directory
2 2 (4.55%) Firmware
2 2 (4.55%) VMware Infrastructure
3 1 (2.27%) Microsoft App-V
3 1 (2.27%) Virtual Machines
3 1 (2.27%) VMware ESXi
3 1 (2.27%) VMware NSX
Systems Management
1 5 (11.36%) Ansible
2 2 (4.55%) CASB
2 2 (4.55%) NetBackup
3 1 (2.27%) Cisco CUCM
3 1 (2.27%) Cisco LMS
3 1 (2.27%) Cisco Prime
3 1 (2.27%) Cisco UCCE
3 1 (2.27%) Icinga
3 1 (2.27%) Nagios
3 1 (2.27%) Observium
3 1 (2.27%) Terraform
3 1 (2.27%) vCenter Server
3 1 (2.27%) vMotion
Vendors
1 12 (27.27%) Palo Alto
2 11 (25.00%) Microsoft
3 6 (13.64%) Arista
3 6 (13.64%) Juniper
4 5 (11.36%) Dell
4 5 (11.36%) F5
4 5 (11.36%) Fortinet
5 4 (9.09%) CheckPoint
5 4 (9.09%) HP
5 4 (9.09%) VMware
6 3 (6.82%) Google
6 3 (6.82%) Meraki
7 2 (4.55%) Citrix
7 2 (4.55%) Isilon
7 2 (4.55%) LogicMonitor
7 2 (4.55%) Logitech
7 2 (4.55%) ServiceNow
7 2 (4.55%) Veritas
8 1 (2.27%) Forcepoint
8 1 (2.27%) Oracle