Security Cleared Jobs in the City of London

Security Clearance
Central London > City of London

The table below provides summary statistics for permanent job vacancies advertised in the City of London with a requirement for Security Cleared qualifications. It includes a benchmarking guide to the salaries offered over the 6 months leading up to 15 June 2025, comparing them to the same period in the previous two years.

6 months to
15 Jun 2025
Same period 2024 Same period 2023
Rank 72 48 49
Rank change year-on-year -24 +1 +39
Permanent jobs citing Security Cleared 70 170 263
As % of all permanent jobs advertised in the City of London 3.58% 5.03% 5.97%
As % of the Qualifications category 11.73% 17.45% 25.53%
Number of salaries quoted 58 73 134
10th Percentile £44,590 £46,250 £47,500
25th Percentile £47,500 £47,500 £53,750
Median annual salary (50th Percentile) £65,000 £61,500 £67,750
Median % change year-on-year +5.69% -9.23% -3.21%
75th Percentile £86,250 £75,000 £78,750
90th Percentile £95,000 £87,000 £99,250
Central London median annual salary £65,000 £62,000 £68,000
% change year-on-year +4.84% -8.82% -2.86%

All Academic and Professional Certifications
City of London

Security Cleared falls under the Academic Qualifications and Professional Certifications category. For comparison with the information above, the following table provides summary statistics for all permanent job vacancies requiring academic qualifications or professional certifications in the City of London.

Permanent vacancies requiring academic qualifications or professional certifications 597 974 1,030
As % of all permanent jobs advertised in the City of London 30.54% 28.84% 23.39%
Number of salaries quoted 390 624 724
10th Percentile £41,250 £41,250 £41,250
25th Percentile £47,500 £47,500 £52,500
Median annual salary (50th Percentile) £65,000 £70,000 £67,750
Median % change year-on-year -7.14% +3.32% -3.21%
75th Percentile £90,750 £92,500 £97,500
90th Percentile £117,500 £105,000 £121,750
Central London median annual salary £70,000 £67,500 £67,500
% change year-on-year +3.70% - -3.57%

Security Cleared
Job Vacancy Trend in the City of London

Job postings citing Security Cleared as a proportion of all IT jobs advertised in the City of London.
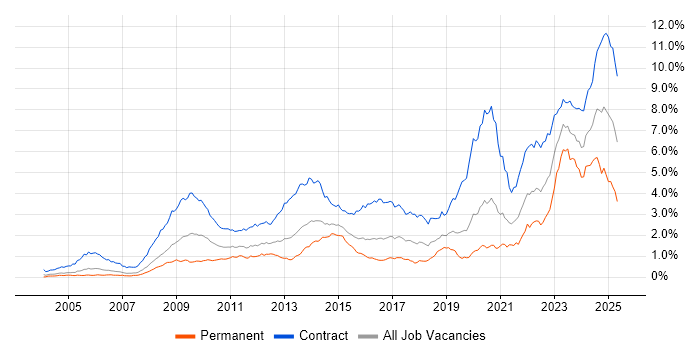
Job vacancy trend for Security Cleared in the City of London

Security Cleared
Salary Trend in the City of London

3-month moving average salary quoted in jobs citing Security Cleared in the City of London.

Salary trend for Security Cleared in the City of London

Security Cleared
Salary Histogram in the City of London

Salary distribution for jobs citing Security Cleared in the City of London over the 6 months to 15 June 2025.

Salary histogram for Security Cleared in the City of London

Security Cleared
Co-occurring Skills and Capabilities in the City of London by Category

The follow tables expand on the table above by listing co-occurrences grouped by category. The same employment type, locality and period is covered with up to 20 co-occurrences shown in each of the following categories:

Application Platforms
1 5 (7.14%) Microsoft Exchange
2 3 (4.29%) Exchange Server 2010
2 3 (4.29%) Exchange Server 2013
3 2 (2.86%) BizTalk Server
3 2 (2.86%) SharePoint
4 1 (1.43%) Alfresco
4 1 (1.43%) Apache
4 1 (1.43%) Camunda
4 1 (1.43%) CMS
4 1 (1.43%) Headless CMS
Applications
1 6 (8.57%) Adobe XD
1 6 (8.57%) InVision
1 6 (8.57%) Sketch
Business Applications
1 3 (4.29%) SAP S/4HANA
2 2 (2.86%) Dynamics CRM
3 1 (1.43%) Oracle EBS
3 1 (1.43%) SAP CO
3 1 (1.43%) SAP FI
3 1 (1.43%) SAP FI/CO
3 1 (1.43%) SAP LE
Cloud Services
1 19 (27.14%) Azure
2 12 (17.14%) AWS
3 7 (10.00%) Figma
4 6 (8.57%) GCP
4 6 (8.57%) Microsoft 365
5 4 (5.71%) AWS CloudFormation
6 3 (4.29%) Amazon EKS
6 3 (4.29%) Azure DevOps
6 3 (4.29%) Cloud Computing
6 3 (4.29%) Dynamics 365
6 3 (4.29%) IaaS
6 3 (4.29%) PaaS
6 3 (4.29%) SaaS
7 2 (2.86%) Azure Machine Learning
7 2 (2.86%) OpenShift
7 2 (2.86%) Power Platform
8 1 (1.43%) Amazon SageMaker
8 1 (1.43%) GitHub
8 1 (1.43%) OneDrive
8 1 (1.43%) Serverless
Communications & Networking
1 3 (4.29%) Firewall
2 2 (2.86%) Cisco ISE
2 2 (2.86%) Ethernet
2 2 (2.86%) LAN
2 2 (2.86%) SD-WAN
2 2 (2.86%) WAN
3 1 (1.43%) Intranet
3 1 (1.43%) NAS
3 1 (1.43%) SAN
3 1 (1.43%) Structured Cabling
3 1 (1.43%) Wi-Fi
3 1 (1.43%) Wireless
3 1 (1.43%) Wireshark
Database & Business Intelligence
1 5 (7.14%) SQL Server
2 3 (4.29%) Elasticsearch
3 2 (2.86%) MongoDB
4 1 (1.43%) MySQL
4 1 (1.43%) NoSQL
4 1 (1.43%) PostgreSQL
4 1 (1.43%) SAP BW
4 1 (1.43%) SAP HANA
Development Applications
1 6 (8.57%) Axure RP
2 3 (4.29%) Git
3 1 (1.43%) CircleCI
3 1 (1.43%) Jenkins
3 1 (1.43%) JIRA
3 1 (1.43%) MSI
3 1 (1.43%) Storybook
3 1 (1.43%) Vagrant
General
1 19 (27.14%) Law
2 17 (24.29%) Social Skills
3 14 (20.00%) Public Sector
4 13 (18.57%) Analytical Skills
5 7 (10.00%) Inclusion and Diversity
6 5 (7.14%) Finance
7 2 (2.86%) Influencing Skills
8 1 (1.43%) Legal
8 1 (1.43%) Telecoms
Job Titles
1 24 (34.29%) Developer
2 22 (31.43%) Consultant
3 9 (12.86%) Senior
4 8 (11.43%) Lead
5 7 (10.00%) Architect
6 6 (8.57%) Designer
6 6 (8.57%) Service Designer
6 6 (8.57%) User Experience Consultant
6 6 (8.57%) UX Developer
7 5 (7.14%) Senior Developer
8 4 (5.71%) Java Developer
8 4 (5.71%) Oracle Consultant
8 4 (5.71%) Software Developer
8 4 (5.71%) Technical Leader
9 3 (4.29%) 1st Line Support
9 3 (4.29%) Analyst
9 3 (4.29%) DV Cleared Java Developer
9 3 (4.29%) Salesforce Developer
10 2 (2.86%) Network Architect
10 2 (2.86%) SAP Consultant
Libraries, Frameworks & Software Standards
1 11 (15.71%) HTML
2 10 (14.29%) CSS
3 7 (10.00%) .NET
4 5 (7.14%) AngularJS
4 5 (7.14%) React
5 4 (5.71%) HTML5
5 4 (5.71%) Node.js
5 4 (5.71%) Vue
6 3 (4.29%) .NET Core
6 3 (4.29%) .NET Framework
6 3 (4.29%) ASP.NET Web API
6 3 (4.29%) Lightning Web Components
6 3 (4.29%) Pandas
6 3 (4.29%) RESTful
6 3 (4.29%) Sass
7 2 (2.86%) JSON
7 2 (2.86%) OpenTelemetry
7 2 (2.86%) Oracle Fusion
7 2 (2.86%) REST
7 2 (2.86%) Spring Boot
Miscellaneous
1 7 (10.00%) Product Ownership
2 4 (5.71%) Cyberattack
2 4 (5.71%) Management Information System
2 4 (5.71%) Public Cloud
3 3 (4.29%) Cloud Native
3 3 (4.29%) Cyber Defence
3 3 (4.29%) Data Centre
3 3 (4.29%) Freedom of Information
3 3 (4.29%) Virtual Team
4 2 (2.86%) CSOC
4 2 (2.86%) Onboarding
5 1 (1.43%) Cyber Kill Chain
5 1 (1.43%) Cyber Threat
5 1 (1.43%) Driving Licence
5 1 (1.43%) Greenfield Project
5 1 (1.43%) Industrial Internet of Things
5 1 (1.43%) Mobile App
5 1 (1.43%) Private Cloud
5 1 (1.43%) Security Posture
Operating Systems
1 7 (10.00%) Windows
2 5 (7.14%) Linux
3 3 (4.29%) Android
3 3 (4.29%) Windows 7
3 3 (4.29%) Windows Server
3 3 (4.29%) Windows Server 2008
3 3 (4.29%) Windows Server 2012
Processes & Methodologies
1 27 (38.57%) Agile
2 17 (24.29%) DevOps
3 15 (21.43%) User Research
4 13 (18.57%) Mentoring
4 13 (18.57%) Problem-Solving
4 13 (18.57%) Workshop Facilitation
5 12 (17.14%) Inclusive Design
5 12 (17.14%) User Experience
5 12 (17.14%) User Stories
5 12 (17.14%) User-Centered Design (UCD)
6 11 (15.71%) Collaborative Working
7 10 (14.29%) Continuous Improvement
8 8 (11.43%) Coaching
8 8 (11.43%) Stakeholder Management
9 7 (10.00%) Presales
9 7 (10.00%) Scrum
9 7 (10.00%) Service Management
9 7 (10.00%) Sprint Planning
10 6 (8.57%) Critical Thinking
10 6 (8.57%) Design Thinking
Programming Languages
1 13 (18.57%) Java
1 13 (18.57%) JavaScript
2 9 (12.86%) Python
3 6 (8.57%) C++
3 6 (8.57%) TypeScript
4 5 (7.14%) C#
4 5 (7.14%) SQL
5 4 (5.71%) Go
6 3 (4.29%) Apex Code
6 3 (4.29%) Rust
7 2 (2.86%) PowerShell
8 1 (1.43%) ABAP
8 1 (1.43%) Bash
8 1 (1.43%) Kusto Query Language
Qualifications
1 29 (41.43%) SC Cleared
2 19 (27.14%) DV Cleared
3 6 (8.57%) Degree
4 2 (2.86%) ITIL Certification
4 2 (2.86%) PMI Certification
4 2 (2.86%) PMP
5 1 (1.43%) CISA
5 1 (1.43%) CISM
5 1 (1.43%) CISSP
5 1 (1.43%) CREST Certified
5 1 (1.43%) CRISC
5 1 (1.43%) SAP Certification
Quality Assurance & Compliance
1 12 (17.14%) Accessibility
2 6 (8.57%) WCAG
3 2 (2.86%) GDPR
3 2 (2.86%) NIST
4 1 (1.43%) GRC
4 1 (1.43%) ISO/IEC 27001
4 1 (1.43%) NIST 800
4 1 (1.43%) PMBOK
System Software
1 8 (11.43%) Docker
2 7 (10.00%) Active Directory
3 3 (4.29%) VMware Infrastructure
4 2 (2.86%) VMware NSX
5 1 (1.43%) Apache ZooKeeper
Systems Management
1 10 (14.29%) Kubernetes
2 7 (10.00%) Terraform
3 6 (8.57%) Ansible
4 2 (2.86%) FortiGate
4 2 (2.86%) Prometheus
4 2 (2.86%) QRadar
5 1 (1.43%) Consul
5 1 (1.43%) Istio
5 1 (1.43%) Microsoft Intune
5 1 (1.43%) Packer
5 1 (1.43%) Progress Chef
5 1 (1.43%) Puppet
5 1 (1.43%) Salt
5 1 (1.43%) SCCM
Vendors
1 11 (15.71%) Microsoft
2 6 (8.57%) Adobe
3 5 (7.14%) VMware
4 4 (5.71%) Google
4 4 (5.71%) Oracle
4 4 (5.71%) SAP
5 3 (4.29%) Cisco
5 3 (4.29%) Salesforce
6 2 (2.86%) Blue Coat
6 2 (2.86%) CheckPoint
6 2 (2.86%) Dynatrace
6 2 (2.86%) F5
7 1 (1.43%) Aruba
7 1 (1.43%) Databricks
7 1 (1.43%) Fortinet
7 1 (1.43%) HP
7 1 (1.43%) Meraki
7 1 (1.43%) Progress
7 1 (1.43%) Ruckus Wireless
7 1 (1.43%) Workday