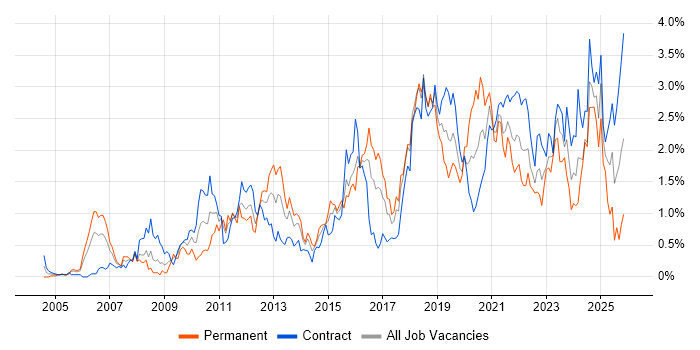
Solution Architect
Scotland > Glasgow
The median Solution Architect salary in Glasgow is £55,000 per year, according to job vacancies posted during the 6 months leading to 27 January 2026.
The table below compares current salary benchmarking and summary statistics with the previous two years.
|
|
6 months to
27 Jan 2026 |
Same period 2025 |
Same period 2024 |
| Rank |
49 |
44 |
137 |
| Rank change year-on-year |
-5 |
+93 |
-36 |
| Permanent jobs requiring a Solutions Architect |
4 |
23 |
13 |
| As % of all permanent jobs in Glasgow |
0.57% |
3.50% |
0.77% |
| As % of the Job Titles category |
0.62% |
3.61% |
0.79% |
| Number of salaries quoted |
1 |
11 |
8 |
| 10th Percentile |
- |
£59,000 |
£60,200 |
| 25th Percentile |
- |
£60,625 |
£61,250 |
| Median annual salary (50th Percentile) |
£55,000 |
£70,000 |
£83,750 |
| Median % change year-on-year |
-21.43% |
-16.42% |
+28.85% |
| 75th Percentile |
- |
£90,125 |
£86,250 |
| 90th Percentile |
- |
£97,500 |
£94,500 |
| Scotland median annual salary |
£87,500 |
£80,000 |
£70,576 |
| % change year-on-year |
+9.38% |
+13.35% |
-2.65% |
For comparison with the information above, the following table provides summary statistics for all permanent IT job vacancies in Glasgow. Most job vacancies include a discernible job title that can be normalized. As such, the figures in the second row provide an indication of the number of permanent jobs in our overall sample.
| Permanent vacancies in Glasgow with a recognized job title |
646 |
638 |
1,650 |
| % of permanent jobs with a recognized job title |
91.37% |
96.96% |
97.81% |
| Number of salaries quoted |
375 |
279 |
583 |
| 10th Percentile |
£28,250 |
£32,700 |
£26,300 |
| 25th Percentile |
£31,000 |
£40,000 |
£36,875 |
| Median annual salary (50th Percentile) |
£50,000 |
£55,000 |
£50,000 |
| Median % change year-on-year |
-9.09% |
+10.00% |
-4.76% |
| 75th Percentile |
£67,500 |
£75,000 |
£65,000 |
| 90th Percentile |
£85,000 |
£95,000 |
£77,500 |
| Scotland median annual salary |
£45,000 |
£55,000 |
£50,000 |
| % change year-on-year |
-18.18% |
+10.00% |
-12.94% |


